Mithril Gives Exploration Update Including Channel Sample Results Up To 4,520 G/T Silver, And 38.2 G/T Gold As Expansion Of The District Continues At Copalquin, Mexico
Melbourne, Australia and Vancouver, Canada -December 1, 2025 Mithril Silver and Gold Limited ("Mithril' or the "Company") (TSXV: MSG) (ASX: MTH) (OTCQB: MTIRF) is pleased to provide an exploration update over multiple targets at the district scale Copalquin property, Durango State, Mexico.
- Channel sampling across multiple district targets continues to deliver high-grade gold and silver with highlights including:
- o 0.50 m @ 16.8 g/t gold, 625 g/t silver ( Target 1 West -El Gallo)
- o 0.60 m @ 38.3 g/t gold, 4,520 g/t silver ( Target 5 - Candelaria)
- o 0.65 m @ 16.0 g/t gold, 284 g/t silver ( Target 3 -El Jabali)
- Ongoing petrographic work is confirming Mithril's district scale model for the Copalquin epithermal system which has a vertical mineralised extent of over 1,200m.
- This work is vectoring into potential feeder zones at Target 1, around Refugio West drill holes MTHRE25-044 and 045 (7.20 m @ 2.78 g/t gold, 148 g/t silver plus 2.80 m @ 3.97 g/t gold, 208 g/t silver and 8.03 m @ 7.19 g/t gold, 260 g/t silver respectively) 1 , and around Target 1 South drill hole MTH-ZG25-037 (0.57 m @ 6.80 g/t gold and 4,400 g/t silver) 2 , both of which are interpreted to lie along the same northwest trending structure (the Copalquin Structure).
- Target 1 resource update drilling continued, successfully expanding mineralisation to the west and providing valuable input into the Target 1 geology model that is now robust and predictive.
- Target 5 drilling, mapping and channel sampling results continue to expand this highly prospective area in the southwest of the district. A further 8 drill holes have been completed at Target 5 with assays pending.
- Target 3 is ready for the first phase of drilling, commencing early January 2026. Target 3 includes several high-grade historic workings including the El Jabali underground mine.
' Copalquin continues to demonstrate its exceptional scale and continuity, ' commented John Skeet, Managing Director & CEO . ' High-grade results from multiple targets across 9 kilometres with more than a kilometre of vertical extent, confirm we are advancing a large, district scale epithermal goldsilver system.
Our detailed study of the recent high-grade intercepts at Refugio West, Zaragoza and Target 5 (Apomal) validate the deeper plumbing of a large, vertically extensive epithermal system. This supports our modelling and demonstrates the true scale and potential of the Copalquin district. With the upcoming Target 1 resource update, Target 5 expanding and Target 3 drill-ready, we are systematically defining a high-grade, multi-target gold-silver district. Throughout 2025 we have completed the detailed groundwork ahead of a fully funded exploration program in 2026, which includes 25,000 metres of drilling in the first 6 months. '
1 See ASX announcement 16 Oct. 2025, 300 Metre T1 Extension -10.9 G/T AUEQ over 8.03m
2 See ASX announcement 28 Aug. 2025 MTH ACCELERATES EXPLORATION WITH NEW DRILLING AT TARGET 5


COPALQUIN GOLD-SILVER DISTRICT, DURANGO STATE, MEXICO
With 100 historic underground gold-silver mines and workings plus 198 surface workings/pits throughout 70km 2 of mining concession area, Copalquin is an entire mining district with high-grade exploration results and a maiden JORC resource. To date there are several target areas in the district with one already hosting a high-grade gold-silver JORC mineral resource estimate (MRE) at the Target 1 area (El RefugioLa Soledad) 3 and a NI 43-101 Technical Report filed on SEDAR+, supported by a conceptional underground mining study completed on the maiden resource in early 2022 and metallurgical test work (see ASX Announcement 25 February 2022 ). There is considerable strike and depth potential to increase the resource at El Refugio and at other target areas across the district, plus the underlying geologic system that is responsible for the widespread gold-silver mineralisation.
With the district-wide gold and silver occurrences and rapid exploration success, it is clear the Copalquin District is developing into another significant gold-silver district like the many other districts in this prolific Sierra Madre Gold-Silver Trend of Mexico.
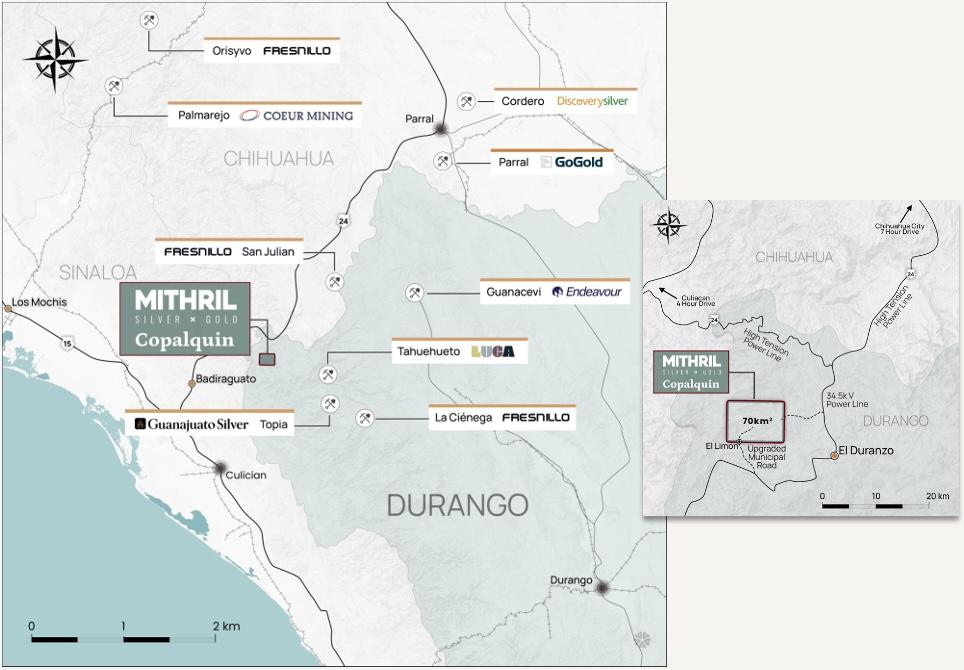
Figure 1 -Copalquin District location map, locations of mining and exploration activity and local infrastructure.
3 See 'About Copalquin Gold Silver Project' section for JORC MRE details and AuEq. calculation.


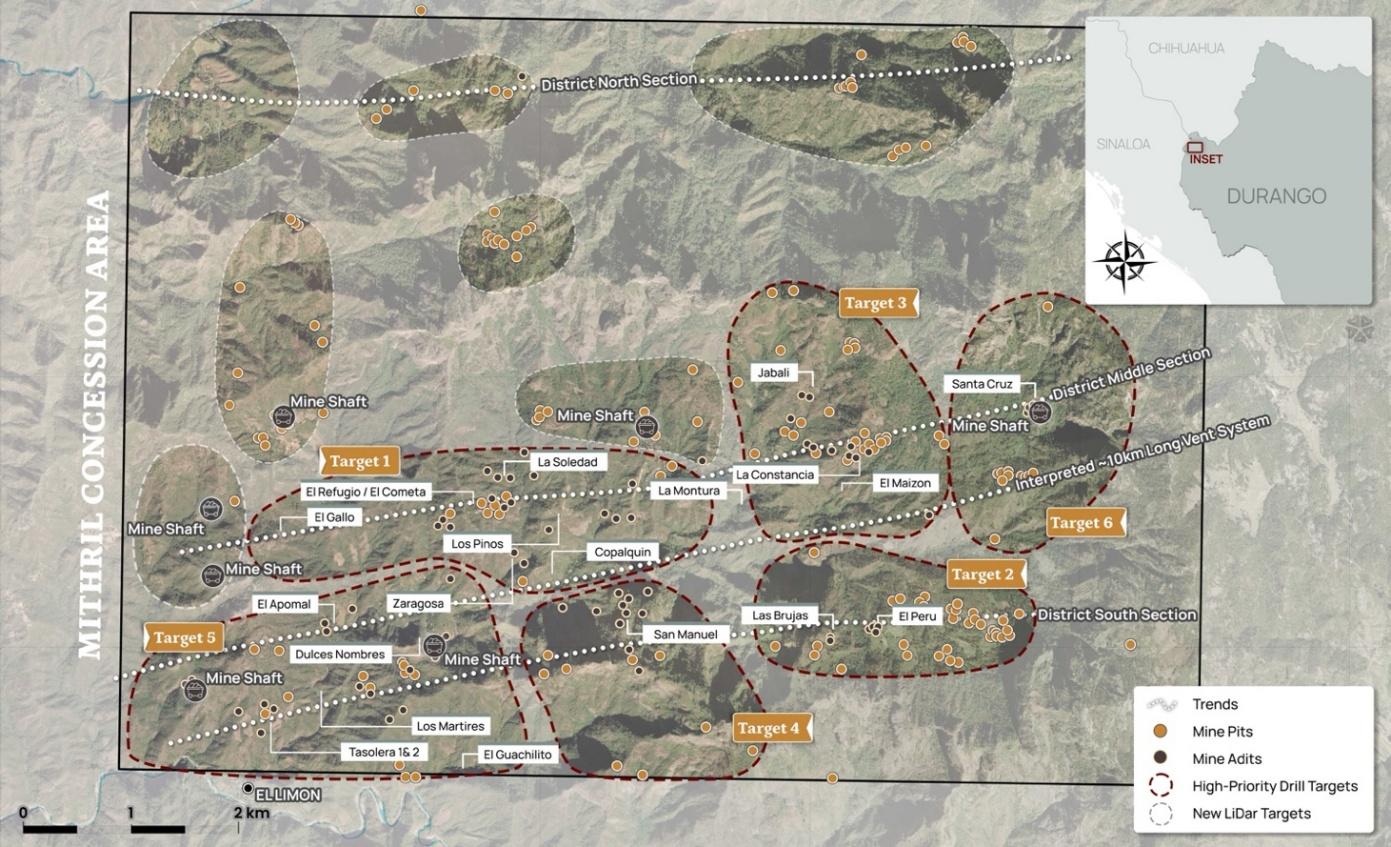
Figure 2 LiDAR identified historic workings across the 70km2 district. Current drilling locations at Target 1 west and Target 5 (El Apomal), and recent drilling at Zaragoza mine in Target 1 south, high priority drill target area of La Constancia-El Jabali (Target 3). Several new areas highlighted across the district for follow-up work including recently sampled Target 6
Copalquin District Exploration Progress Update
Drilling
Drilling continues at Copalquin at Targets 1 and 5, with work at Target 1 focused on expanding mineralization in the Refugio West area. Defining the geometry of the Refugio structure and its relationship to post mineral dykes and sills remains critical for refining the exploration model.
Drilling at Target 5 continues to test continuous high grade quartz veins traced for more than 1.2 km along surface and from underground workings (Figure 5). Upcoming holes will focus on the Tasolera workings, located roughly 500 m southeast along strike from Apomal (Figure 5).
Channel Sampling
Channel sampling at the Copalquin Project continues to deliver strong results from both surface and underground workings, reinforcing the continuity and grade potential of the district's principal vein systems. Recent channels consistently report high grade gold and silver values along well-developed structures, confirming that mineralization is both laterally and vertically extensive (8 km and 1.2 km, respectively) across the project area. These results strengthen confidence in the modelled geometry of the Refugio, Soledad, Zaragoza, and related veins, and they validate ongoing exploration aimed at expanding known mineralized zones and identifying additional high-grade shoots along strike and at depth.
Target 1
Gold and silver samples from the Guacima Mine and the El Gallo area, located approximately 500 and 950 meters west of mineralized drillholes MTH-RE25-44 and 45, respectively, confirm the presence of additional mineralized structures that extend the broader footprint of the Copalquin system Figure 4.


Surface samples collected to the southeast of the Copalquin structure returned grades up to 1 g/t gold and 770 g/t silver. The Copalquin structure, tested to date in the Zaragoza and Copalquin areas, remains open down dip and along strike to both the northwest and southeast. At Zaragoza, drillhole MTH-ZG25037 intersected 0.57 m grading 6.80 g/t gold and 4,400 g/t silver , an interval interpreted to lie on the same northwest trending Copalquin Structure (Figure 8).
Additionally, several samples have returned promising results from a 1.2 m wide , banded quartz vein located 650 m north of Los Reyes and 650 m northeast of La Soledad with up to 2 g/t Au and 201 g/t Ag .
Target 3
Underground sampling at Jabali continues to yield excellent results from historic workings. Samples from a previously unsampled working have returned up to 15.95 g/t Au and 1275 g/t Ag over a 0.65 m interval. These samples further highlight the prospective nature of Target 3.
Target 5
Underground and surface sampling from the San Miguel Mine, located 550 m southeast of Tasolera and 1.2 km southeast along trend from the Apomal vein system, has returned several high-grade silver assays and anomalous to locally high-grade gold values. These samples display Ag:Au ratios characteristic of Target 5, commonly greater than 100:1. Although most samples contain low to moderate gold, one 0.60 m interval returned 38.3 g/t Au and 4,520 g/t Ag . These results are consistent with the very high-grade samples collected at Apomal and Tasolera, underscoring the continuity and strength of mineralization across Target 5.
Table 1 Highlights of surface and underground sample assay results
| Sample | Easting (m) | Northing (m) | Elevation (m) | Surface/ UG | Location | Width (m) | Au (g/t) | Ag (g/t) | Cu (g/t) | Pb (g/t) | Zn (g/t) |
|---|---|---|---|---|---|---|---|---|---|---|---|
| 815820 | 287880 | 2822314 | 720 | Surface | Los Martires | 0.90 | 0.8 | 106 | 28 | 482 | 332 |
| 815826 | 287526 | 2821913 | 749 | Surface | El Limon | 0.50 | 2.53 | 501 | 116 | 205 | 130 |
| 815832 | 287126 | 2821566 | 724 | Surface | El Limon | 0.30 | 0.643 | 59.6 | 8 | 23 | 29 |
| 815834 | 287099 | 2821670 | 721 | Surface | El Limon | 1.00 | 0.668 | 25.7 | 36 | 11 | 49 |
| 815839 | 287650 | 2823707 | 979 | Surface | El Platano | 0.80 | 3.55 | 77 | 123 | 1120 | 35 |
| 815843 | 287627 | 2823692 | 980 | Surface | El Platano | 0.73 | 1.04 | 48 | 36 | 47 | 25 |
| 815772 | 287843 | 2822716 | 766 | Surface | Apomal | 0.50 | 16.8 | 625 | 98 | 240 | 164 |
| 815869 | 288132 | 2823629 | 995 | Surface | La Guacima | 1.00 | 0.477 | 46.5 | 21 | 76 | 57 |
| 815873 | 288130 | 2823631 | 996 | Surface | La Guacima | 0.50 | 3.01 | 198 | 13 | 105 | 81 |
| 815896 | 287663 | 2822032 | 808 | Surface | Camino El Limon | 0.60 | 0.617 | 136 | 62 | 5180 | 796 |
| 815897 | 287646 | 2822082 | 820 | Surface | Camino El Limon | 0.40 | 0.875 | 179 | 31 | 2080 | 281 |
| 815898 | 287615 | 2822234 | 835 | Surface | Camino El Limon | 1.10 | 0.873 | 149 | 41 | 135 | 182 |
| 815899 | 287616 | 2822235 | 835 | Surface | Camino El Limon | 0.50 | 0.558 | 85.6 | 40 | 155 | 144 |
| 815885 | 288724 | 2821914 | 923 | Surface | Candelaria Working | 0.60 | 0.216 | 320 | 74 | 2080 | 259 |
| 815886 | 288635 | 2821817 | 874 | Underground | San Miguel Mine | 0.75 | 1.71 | 314 | 208 | 339 | 277 |
| 815887 | 288634 | 2821817 | 874 | Underground | San Miguel Mine | 0.75 | 0.357 | 67.9 | 143 | 194 | 183 |
| 815888 | 288632 | 2821819 | 874 | Underground | San Miguel Mine | 0.60 | 1.23 | 335 | 92 | 152 | 134 |
| 815889 | 288631 | 2821818 | 874 | Underground | San Miguel Mine | 0.55 | 0.606 | 67.8 | 133 | 223 | 220 |
| 815891 | 288627 | 2821820 | 876 | Underground | San Miguel Mine | 0.60 | 38.3 | 4520 | 1945 | 4460 | 523 |
| 815892 | 288625 | 2821822 | 878 | Underground | San Miguel Mine | 0.60 | 0.482 | 77.4 | 546 | 415 | 143 |
| 815893 | 288621 | 2821823 | 878 | Underground | San Miguel Mine | 0.60 | 0.624 | 59.5 | 196 | 499 | 188 |
| 815894 | 288617 | 2821825 | 880 | Surface | San Miguel Mine | 0.65 | 1.055 | 123 | 43 | 96 | 75 |
| 815895 | 288616 | 2821825 | 880 | Surface | San Miguel Mine | 0.55 | 0.97 | 295 | 182 | 339 | 114 |
| 814734 | 292487 | 2824820 | 1460 | Surface | Jabali mine II | 0.65 | 15.95 | 1275 | 50 | 17 | 42 |
| 814735 | 292487 | 2824820 | 1460 | Surface | Jabali mine II | 0.55 | 0.998 | 641 | 43 | 12 | 45 |
| 814739 | 292450 | 2824837 | 1458 | Underground | Jabali mine II | 1.15 | 4.59 | 396 | 51 | 20 | 34 |
| 814741 | 292454 | 2824840 | 1458 | Underground | Jabali mine II | 0.75 | 6.54 | 157 | 36 | 17 | 58 |
| 814743 | 292466 | 2824837 | 1442 | Underground | Jabali mine I | 1.00 | 2.52 | 126 | 29 | 18 | 20 |
| 814744 | 292466 | 2824837 | 1442 | Underground | Jabali mine I | 1.00 | 2.69 | 55.9 | 30 | 13 | 38 |

| Sample | Easting (m) | Northing (m) | Elevation (m) | Surface/ UG | Location | Width (m) | Au (g/t) | Ag (g/t) | Cu (g/t) | Pb (g/t) | Zn (g/t) |
|---|---|---|---|---|---|---|---|---|---|---|---|
| 814749 | 292508 | 2824820 | 1442 | Underground | Jabali mine I | 0.65 | 0.854 | 50.2 | 6 | 21 | 26 |
| 814852 | 292508 | 2824814 | 1442 | Underground | Jabali mine I | 0.60 | 2.01 | 201 | 9 | 9 | 21 |
| 814853 | 292508 | 2824814 | 1442 | Underground | Jabali mine I | 0.60 | 1.995 | 119 | 34 | 50 | 56 |
| 814854 | 292510 | 2824802 | 1442 | Underground | Jabali mine I | 0.50 | 1.475 | 19.4 | 15 | 17 | 20 |
| 814855 | 292512 | 2824792 | 1442 | Surface | Jabali mine I | 0.50 | 2.62 | 6.9 | 14 | 47 | 47 |
| 814768 | 290269 | 2823165 | 880 | Surface | Copalquin East | 0.80 | 1.01 | 770 | 2730 | 209 | 729 |
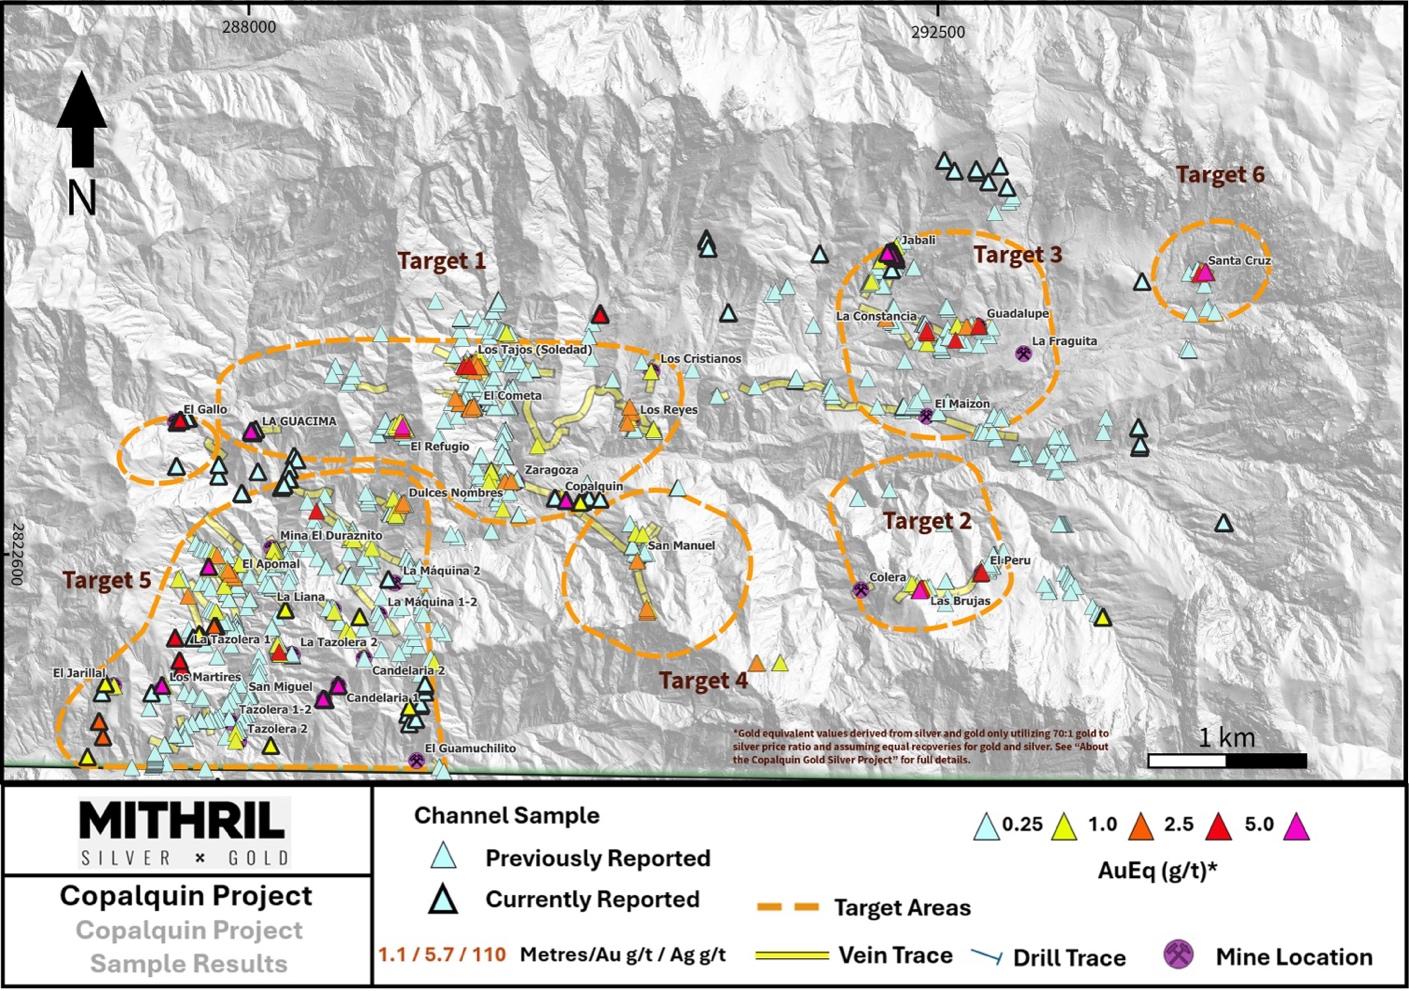
Figure 3 Property-wide channel sampling results for the middle and south district sections within ~50% of the 70 km2 mining concession area covering the Copalquin District


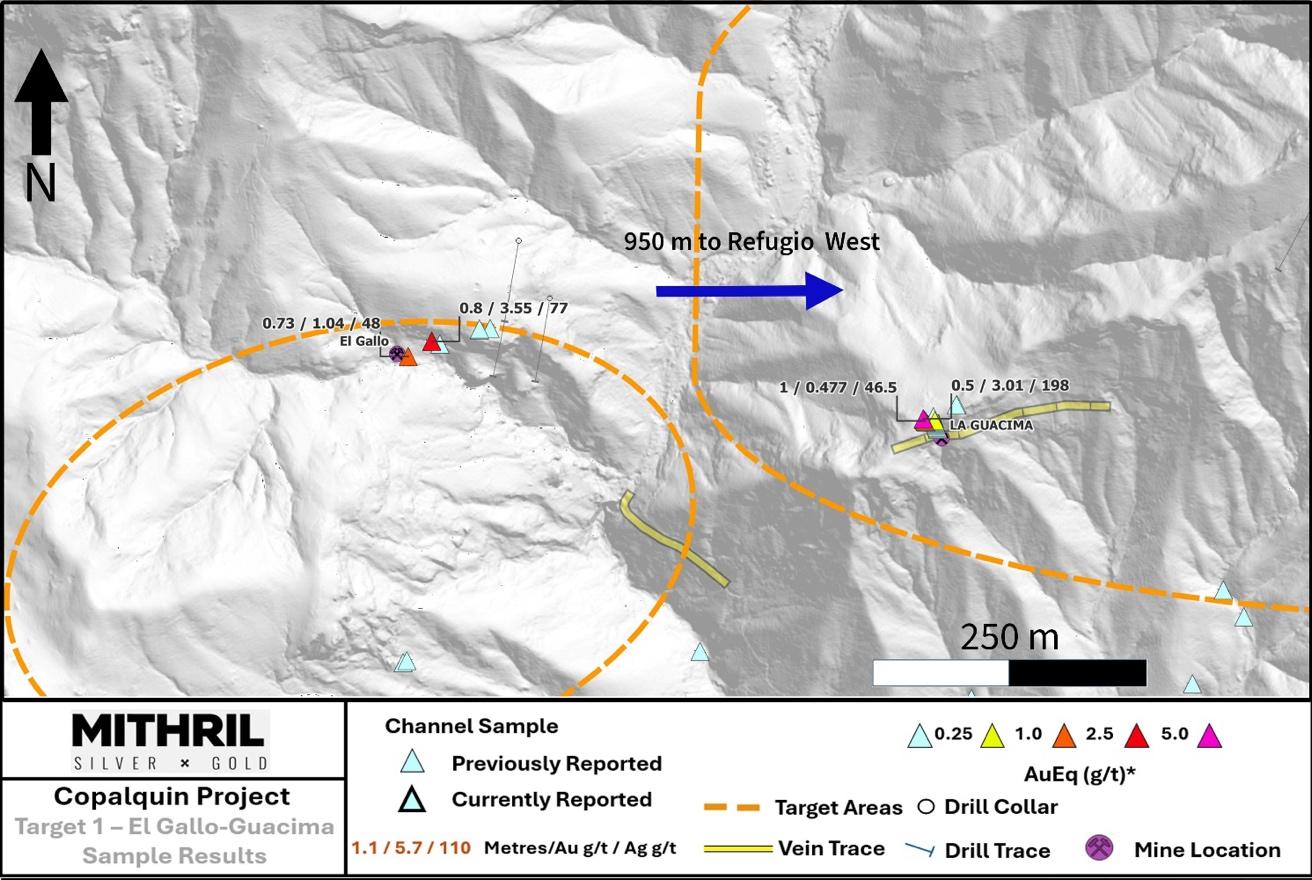
Figure 4 Target 1 channel sampling results. Mineralization of the Refugio structure to the west towards the Guacima Mine and La Soledad
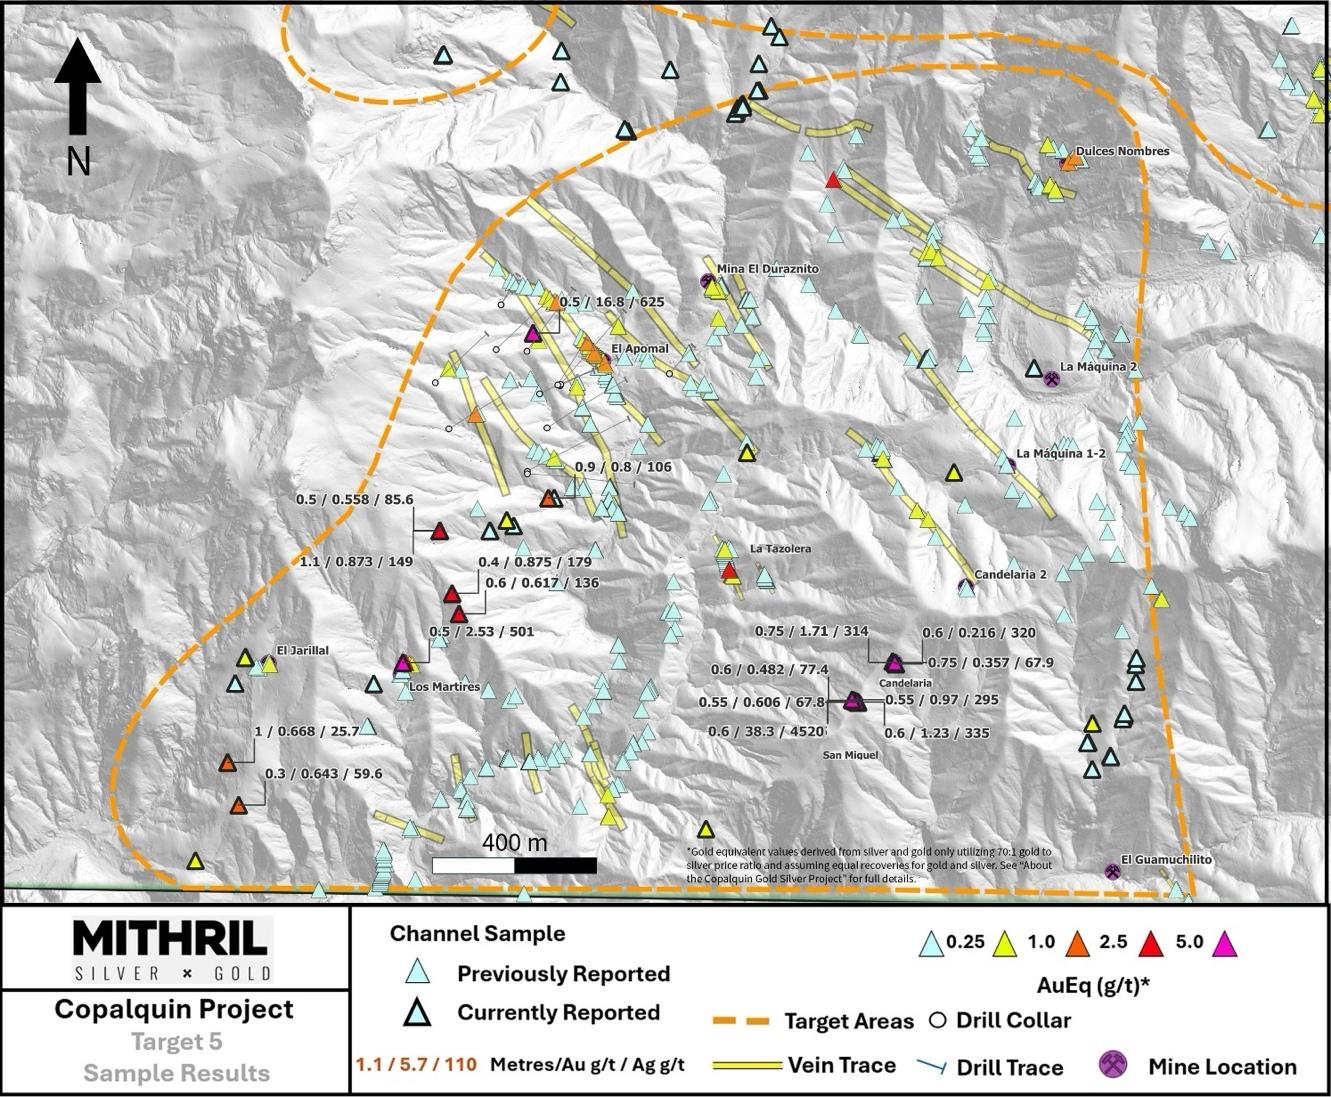
Figure 5 Target 5 channel sampling results. Several NW trending structures with underground workings with strike lengths over 1 km with high-grade channel sampling


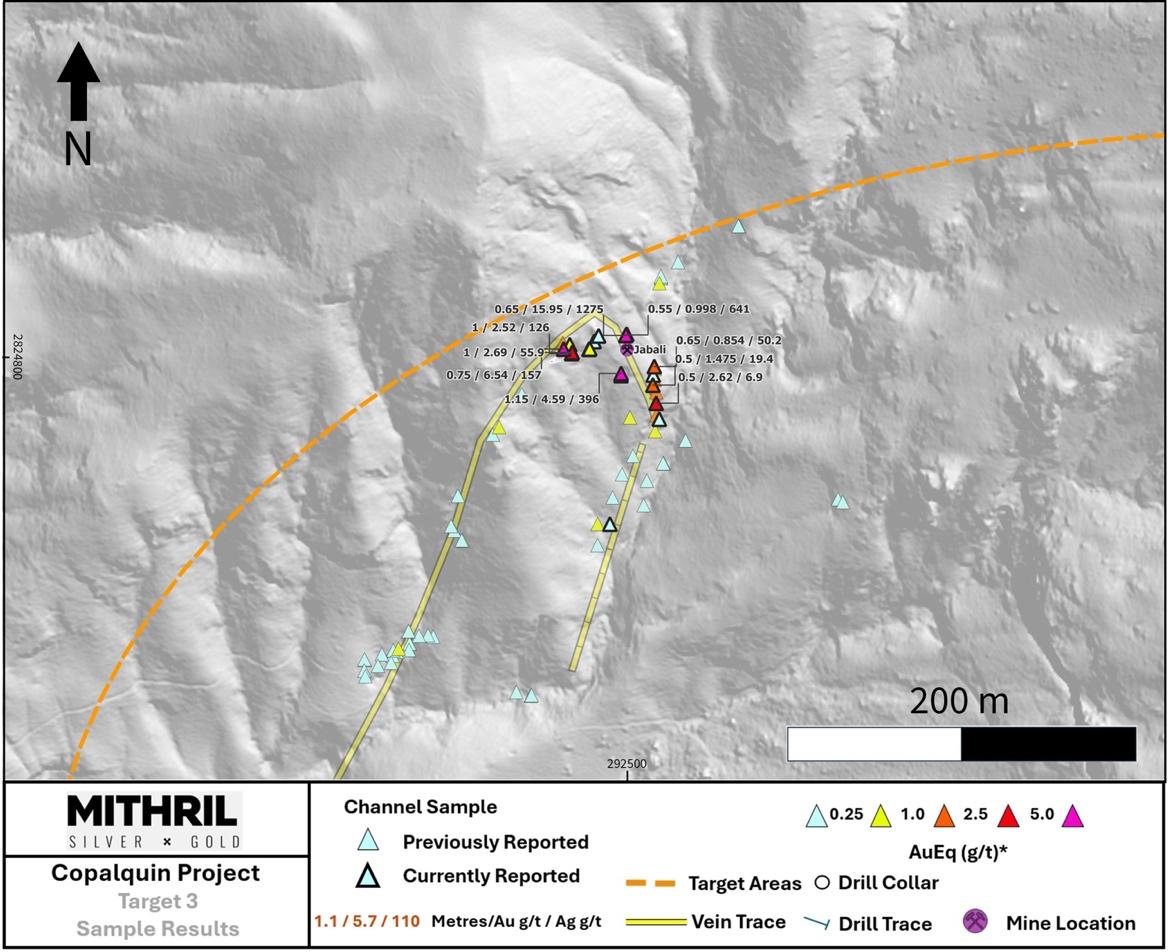
Figure 6 Channel sampling results at the historic El Jabali underground mine in Target 3 where first drilling will commence early January 2026
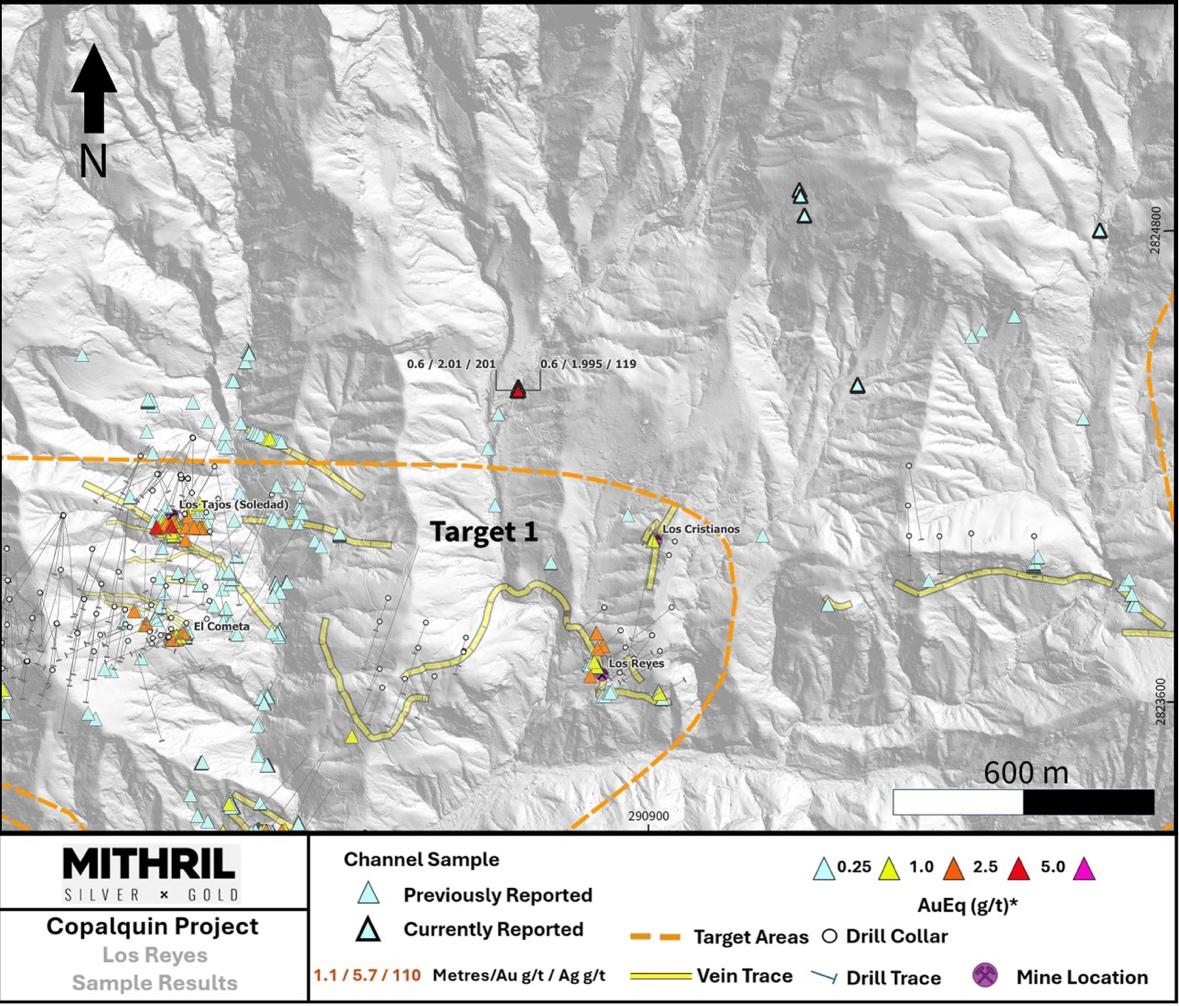
Figure 7 Channel sampling north of the Target 1 resource drilling area


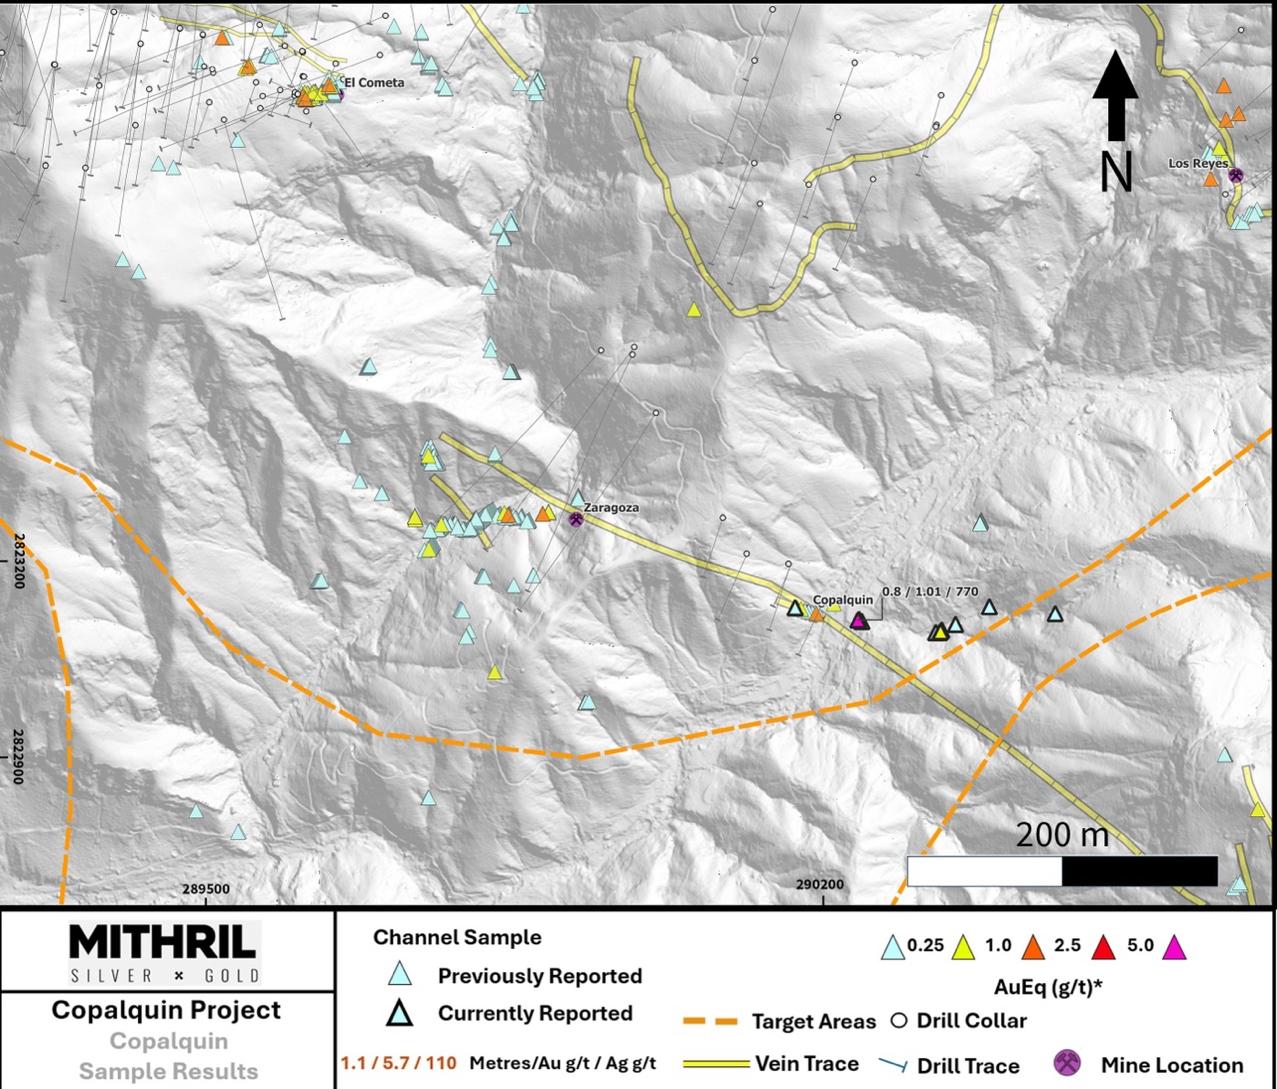
Figure 8 Sampling along the Copalquin Structure at the historic workings of Zaragoza and Copalquin 800-900 metres southeast of the Target 1 resource area


ABOUT THE COPALQUIN GOLD SILVER PROJECT
The Copalquin mining district is located in Durango State, Mexico and covers an entire mining district of 70km 2 containing several dozen historic gold and silver mines and workings, ten of which had notable production. The district is within the Sierra Madre Gold Silver Trend which extends north-south along the western side of Mexico and hosts many gold and silver districts.
Multiple mineralisation events, young intrusives thought to be system-driving heat sources, widespread alteration together with extensive surface vein exposures and dozens of historic mine workings, identify the Copalquin mining district as a major epithermal centre for Gold and Silver.
Within 15 months of drilling in the Copalquin District, Mithril delivered a maiden JORC mineral resource estimate demonstrating the high-grade gold and silver resource potential for the district. This maiden resource is detailed below (see ASX release 17 November 2021 ) ^ and a NI 43-101 Technical Report filed on SEDAR+
- Indicated 691 kt @ 5.43 g/t gold, 114 g/t silver for 121,000 oz gold plus 2,538,000 oz silver
- Inferred 1,725 kt @ 4.55 g/t gold, 152 g/t silver for 252,000 oz gold plus 8,414,000 oz silver (using a cut-off grade of 2.0 g/t AuEq*)
- 28.6% of the resource tonnage is classified as indicated
Table 2 Mineral resource estimate El Refugio -La Soledad using a cut-off grade of 2.0 g/t AuEq*
| Tonnes (kt) | Tonnes (kt) | Gold (g/t) | Silver (g/t) | Gold Eq.* (g/t) | Gold (koz) | Silver (koz) | Gold Eq.* (koz) | |
|---|---|---|---|---|---|---|---|---|
| El Refugio | Indicated | 691 | 5.43 | 114.2 | 7.06 | 121 | 2,538 | 157 |
| Inferred | 1,447 | 4.63 | 137.1 | 6.59 | 215 | 6,377 | 307 | |
| La Soledad | Indicated | - | - | - | - | - | - | - |
| Inferred | 278 | 4.12 | 228.2 | 7.38 | 37 | 2,037 | 66 | |
| Total | Indicated | 691 | 5.43 | 114.2 | 7.06 | 121 | 2,538 | 157 |
| Inferred | 1,725 | 4.55 | 151.7 | 6.72 | 252 | 8,414 | 372 |
- In determining the gold equivalent (AuEq.) grade for reporting, a gold:silver price ratio of 70:1 was determined, using the formula: AuEq grade = Au grade + ((Ag grade/70) x (Ag recovery/Au recovery)). The metal prices used to determine the 70:1 ratio are the cumulative average prices for 2021: gold USD1,798.34 and silver: USD25.32 (actual is 71:1) from kitco.com.
For silver equivalent (AgEq.) grade reporting, the same factors as above are used with the formula AgEq grade = Ag grade + ((Au grade x 70) x (Au recovery/Ag recovery))
At this early stage, the metallurgical recoveries were assumed to be equal (93%). Subsequent preliminary metallurgical test work produced recoveries of 91% for silver and 96% for gold (ASX Announcement 25 February 2022) and these will be used when the resource is updated in the future. In the Company's opinion there is reasonable po tential for both gold and silver to be extracted and sold.
^ The information in this report that relates to Mineral Resources or Ore Reserves is based on information provided in the following ASX announcement: 17 Nov 2021 - MAIDEN JORC RESOURCE 529,000 OUNCES @ 6.81G/T (AuEq * ), which includes the full JORC MRE report, also available on the Mithril Resources Limited Website.
The Company confirms that it is not aware of any new information or data that materially affects the information included in the original market announcement and that all material assumptions and technical parameters underpinning the estimates in the relevant market announcement continue to apply and have not materially changed. The company confirms that the form and context in which the Competent Person's findings are presented have not been materially modified from the original market announcement.
Mining study (conceptual) and metallurgical test work supports the development of the El Refugio-La Soledad resource with conventional underground mining methods indicated as being appropriate and with high gold-silver recovery to produce metal on-site with conventional processing. The average vein width is approximately 4.5 metres.


Mithril is currently exploring in the Copalquin District to expand the resource footprint, demonstrating its multi-million-ounce gold and silver potential. Mithril has an exclusive option to purchase 100% interest in the Copalquin mining concessions by paying US$10M on or any time before 7 August 2028.
-ENDS-
Released with the authority of the Board. For further information contact:
| John Skeet | NIKLICOMMUNICATIONS |
|---|---|
| Managing DirectorandCEO | Corporate Communications |
| jskeet@mithrilsilvergold.com | liz@mithrilsilvergold.com |
| +61 435 766 809 | nicole@mithrilsilvergold.com |
The Australian Securities Exchange has not reviewed and does not accept responsibility for the accuracy or adequacy of this release.
Neither TSX Venture Exchange nor its Regulation Services Provider (as that term is defined in policies of the TSX Venture Exchange) accepts responsibility for the adequacy or accuracy of this release.
Competent Persons Statement - JORC
The information in this announcement that relates to metallurgical test results, mineral processing and project development and study work has been compiled by Mr John Skeet who is Mithril's CEO and Managing Director. Mr Skeet is a Fellow of the Australasian Institute of Mining and Metallurgy. This is a Recognised Professional Organisation (RPO) under the Joint Ore Reserves Committee (JORC) Code.
Mr Skeet has sufficient experience of relevance to the styles of mineralisation and the types of deposits under consideration, and to the activities undertaken, to qualify as a Competent Person as defined in the 2012 Edition of the Joint Ore Reserves Committee (JORC) Australasian Code for Reporting of Exploration Results, Mineral Resources and Ore Reserves. Mr Skeet consents to the inclusion in this report of the matters based on information in the form and context in which it appears. The Australian Securities Exchange has not reviewed and does not accept responsibility for the accuracy or adequacy of this release.
The information in this announcement that relates to sampling techniques and data, exploration results and geological interpretation for Mithril's Mexican project, has been compiled by Mr Darren LeFort who is Mithril's Exploration Manager. Mr LeFort is a member of the Engineers and Geoscientists of British Columbia and a Certified Professional Geologist (P.Geo). This is a Recognised Professional Organisation (RPO) under the Joint Ore Reserves Committee (JORC) Code.
Mr LeFort has sufficient experience of relevance to the styles of mineralisation and the types of deposits under consideration, and to the activities undertaken, to qualify as a Competent Person as defined in the 2012 Edition of the Joint Ore Reserves Committee (JORC) Australasian Code for Reporting of Exploration Results, Mineral Resources and Ore Reserves. Mr LeFort consents to the inclusion in this report of the matters based on information in the form and context in which it appears.
The information in this announcement that relates to Mineral Resources is reported by Mr Rodney Webster, former Principal Geologist at AMC Consultants Pty Ltd (AMC), who is a Member of the Australian Institute of Geoscientists. The report was peer reviewed by Andrew Proudman, Principal Consultant at AMC. Mr Webster is acting as the Competent Person, as defined in the 2012 Edition of the Joint Ore Reserves Committee (JORC) Australasian Code for Reporting of Exploration Results, Mineral Resources and Ore Reserves, for the reporting of the Mineral Resource estimate. A site visit was carried out by Jose Olmedo a geological consultant with AMC, in September 2021 to observe the drilling, logging, sampling and assay database. Mr Webster consents to the inclusion in this report of the matters based on information in the form and context in which it appears


Qualified Persons -NI 43-101
Scientific and technical information in this Report has been reviewed and approved by Mr John Skeet (FAUSIMM, CP) Mithril's Managing Director and Chief Executive Officer. Mr John Skeet is a qualified person within the meaning of NI 43-101.
Samples are sent to ALS Global with sample preparation performed in Chihuahua City, Mexico and assaying of sample pulps performed in North Vancouver, BC, Canada
A cautionary note regarding surface and channel samples, which by their nature, are selective samples and may not represent true underlying mineralization.
Table 3 All Channel Sampling Results reported in this announcement
| Sample | Easting (m) | Northing (m) | Elevation (m) | Surface/UG | Location | Width (m) | Au (g/t) | Ag (g/t) | Cu (g/t) | Pb (g/t) | Zn (g/t) |
|---|---|---|---|---|---|---|---|---|---|---|---|
| 815785 | 288145 | 2823621 | 977 | Underground | La Guacima | 1.00 | 0.014 | 2.5 | 26 | 21 | 57 |
| 815786 | 288144 | 2823622 | 977 | Underground | La Guacima | 1.00 | 0.027 | 0.7 | 11 | 10 | 52 |
| 815788 | 288144 | 2823623 | 977 | Underground | La Guacima | 1.00 | 0.031 | 0.7 | 9 | 11 | 48 |
| 815789 | 288144 | 2823624 | 977 | Underground | La Guacima | 1.00 | 0.012 | 0.5 | 4 | 12 | 142 |
| 815790 | 288143 | 2823625 | 977 | Underground | La Guacima | 1.00 | 0.028 | 1.7 | 20 | 19 | 288 |
| 815791 | 288143 | 2823625 | 977 | Underground | La Guacima | 1.00 | 0.023 | 1.8 | 28 | 14 | 318 |
| 815792 | 288142 | 2823626 | 977 | Underground | La Guacima | 1.00 | 0.009 | 1.9 | 28 | 16 | 71 |
| 815793 | 288142 | 2823627 | 977 | Underground | La Guacima | 1.00 | 0.025 | 3.1 | 38 | 14 | 75 |
| 815794 | 288142 | 2823628 | 977 | Underground | La Guacima | 1.00 | 0.029 | 2.6 | 7 | 11 | 18 |
| 815795 | 288141 | 2823629 | 977 | Underground | La Guacima | 1.00 | 0.244 | 16 | 7 | 13 | 16 |
| 815796 | 288141 | 2823630 | 977 | Underground | La Guacima | 1.00 | 0.067 | 9 | 5 | 24 | 13 |
| 815797 | 288141 | 2823631 | 977 | Underground | La Guacima | 1.00 | 0.044 | 6.8 | 4 | 14 | 13 |
| 815798 | 288140 | 2823632 | 977 | Underground | La Guacima | 1.00 | 0.051 | 6.7 | 5 | 14 | 19 |
| 815799 | 288140 | 2823633 | 977 | Underground | La Guacima | 1.00 | 0.014 | 1.5 | 5 | 9 | 31 |
| 815816 | 287796 | 2822247 | 762 | Surface | Los Martires | 1.00 | 0.063 | 5.9 | 89 | 1075 | 955 |
| 815817 | 287779 | 2822260 | 766 | Surface | Los Martires | 0.30 | 0.224 | 36 | 36 | 1605 | 2180 |
| 815818 | 287739 | 2822235 | 794 | Surface | Los Martires | 1.20 | 0.006 | 1 | 38 | 1290 | 189 |
| 815819 | 287738 | 2822235 | 794 | Surface | Los Martires | 0.80 | 0.006 | 1.2 | 86 | 150 | 306 |
| 815820 | 287880 | 2822314 | 720 | Surface | Los Martires | 0.90 | 0.8 | 106 | 28 | 482 | 332 |
| 815821 | 287894 | 2822314 | 698 | Surface | Los Martires | 1.00 | 0.033 | 1.9 | 24 | 380 | 576 |
| 815822 | 288364 | 2822425 | 773 | Surface | Apomal | 0.50 | 0.173 | 25 | 13 | 89 | 111 |
| 815824 | 288868 | 2822377 | 872 | Surface | Candelaria | 0.50 | 0.29 | 33 | 25 | 55 | 109 |
| 815826 | 287526 | 2821913 | 749 | Surface | El Limon | 0.50 | 2.53 | 501 | 116 | 205 | 130 |
| 815828 | 287455 | 2821862 | 755 | Surface | El Limon | 0.80 | 0.038 | 12 | 21 | 125 | 696 |
| 815829 | 287143 | 2821927 | 778 | Surface | El Limon | 0.50 | 0.218 | 21 | 125 | 148 | 259 |
| 815830 | 287142 | 2821925 | 777 | Surface | El Limon | 0.80 | 0.239 | 13 | 73 | 94 | 178 |
| 815831 | 287118 | 2821863 | 748 | Surface | El Limon | 1.00 | 0.025 | 2.5 | 10 | 15 | 60 |
| 815832 | 287126 | 2821566 | 724 | Surface | El Limon | 0.30 | 0.643 | 60 | 8 | 23 | 29 |
| 815833 | 287098 | 2821670 | 721 | Surface | El Limon | 1.00 | 0.2 | 17 | 13 | 13 | 55 |
| 815834 | 287099 | 2821670 | 721 | Surface | El Limon | 1.00 | 0.668 | 26 | 36 | 11 | 49 |
| 815835 | 287021 | 2821431 | 655 | Surface | El Limon | 0.50 | 0.257 | 7.3 | 15 | 6 | 21 |
| 815836 | 287707 | 2823720 | 994 | Surface | El Platano | 1.00 | <0.005 | 1.2 | 14 | 6 | 2 |
| 815837 | 287697 | 2823718 | 1000 | Surface | El Platano | 1.00 | 0.006 | 2 | 9 | 14 | 3 |
| 815838 | 287697 | 2823719 | 1000 | Surface | El Platano | 0.80 | <0.005 | 0.9 | 4 | 8 | 3 |
| 815839 | 287650 | 2823707 | 979 | Surface | El Platano | 0.80 | 3.55 | 77 | 123 | 1120 | 35 |
| 815840 | 287650 | 2823708 | 978 | Surface | El Platano | 1.00 | 0.461 | 16 | 49 | 181 | 71 |
| 815841 | 287658 | 2823704 | 977 | Surface | El Platano | 0.80 | 0.017 | 1.6 | 7 | 20 | 22 |
| 815843 | 287627 | 2823692 | 980 | Surface | El Platano | 0.73 | 1.04 | 48 | 36 | 47 | 25 |
| 814726 | 293214 | 2059 | El Duraznal | 0.75 | <0.5 | 5 | 20 | 40 | |||
| 2825424 | Surface | 0.103 | |||||||||
| 814727 814728 | 293264 293137 | 2825280 2825317 | 2033 | Surface | El Duraznal | 0.50 | 0.006 | <0.5 | 7 3 | 13 13 | 24 40 |
| 814729 | 293063 | 2825380 | 1991 1972 | Surface Surface | El Duraznal El Duraznal | 0.50 0.50 | <0.005 <0.005 | <0.5 <0.5 | 4 | 13 | 38 |
| 814730 | 293055 | 2825401 | 1985 | Surface | El Duraznal | 0.50 | <0.005 | <0.5 | 4 | 12 | 35 |

| Sample | Easting | Northing | Elevation | Surface/UG | Location | Width | Au | Ag (g/t) Cu | Pb | Zn | Zn |
|---|---|---|---|---|---|---|---|---|---|---|---|
| 814731 | (m) | (m) 2825392 | (m) | El Duraznal | (m) 0.50 | (g/t) <0.005 | (g/t) | (g/t) | (g/t) | (g/t) | |
| 814732 | 292907 292838 | 2825462 | 1895 1865 | Surface | El Duraznal | 0.80 | <0.5 <0.005 <0.5 | 5 6 | 19 16 | 57 46 | 57 46 |
| 815772 | 287843 | 2822716 | 766 | Surface Surface | Apomal | 0.50 | 16.8 625 | 98 | 240 | 164 | 164 |
| 815844 | 287622 | 2823393 | 1014 | Surface | El Gallo Sur | 0.40 | 1.9 | 3 | 15 | 19 | 19 |
| 815845 | 287626 | 2823395 | 1014 | Surface | El Gallo Sur | 0.099 0.40 0.065 | 3.1 | 3 | 50 | 10 | 10 |
| 815846 | 288338 | 2823254 | 757 | Surface | La Higuerita | 0.70 0.028 | 9.9 | 11 | 107 | 73 | 73 |
| 815847 | 288335 | 2823251 | 756 | Surface | La Higuerita | 0.70 | 0.023 2 | 40 | 61 | 76 | 76 |
| 815848 | 288341 | 2823264 | 763 | Surface | La Higuerita | 0.50 | 0.008 0.8 | 23 | 113 | 140 | 140 |
| 815849 | 288350 | 2823271 | 771 | Surface | La Higuerita | 0.90 | 0.024 1.4 | 20 | 27 | 35 | 35 |
| 815851 | 288351 | 2823272 | 772 | Surface | La Higuerita | 0.90 | 0.012 1.6 | 20 | 29 | 60 | 60 |
| 815852 | 288351 | 2823272 | 772 | Surface | La Higuerita | 0.90 | 0.014 2.2 | 16 | 44 | 78 | 78 |
| 815853 | 288354 | 2823275 | 773 | Surface | La Higuerita | 0.80 | 0.072 5.5 | 17 | 310 | 175 | 175 |
| 815854 | 288423 | 2823464 | 799 | Surface | La Higuerita | 0.70 | 0.143 2.6 | 25 | 19 | 43 | 43 |
| 815855 | 288443 | 2823438 | 818 | Surface | La Higuerita | 0.50 | 0.008 0.6 | 13 | 32 | 70 | 70 |
| 815856 | 288393 | 2823373 | 770 | Surface | La Higuerita | 0.143 | 4.6 | 108 | 24 | 22 | 22 |
| 815857 | 288394 | 2823308 | 824 | Surface | La Higuerita | 0.50 0.50 0.011 | 0.5 | 10 | 15 | 53 | 53 |
| 815858 | 288389 | 2823307 | 808 | Surface | La Higuerita | 0.50 | 1.1 | 80 | 27 | 42 | 42 |
| 815859 | 288354 | 2823267 | 764 | Surface | La Higuerita | 0.005 0.50 0.109 | 9.2 | 20 | 48 | 68 | 68 |
| 815860 | 289063 | 2822631 | 792 | Surface | La Maquina | 0.70 0.008 | 0.6 | 31 | 19 | 80 | 80 |
| 815861 | 288177 | 2823358 | 727 | Surface | La Higuerita | 0.50 | 0.008 0.5 | 9 | 25 | 30 | 30 |
| 815862 | 288074 | 2823208 | 761 | Surface | La Higuerita | 0.50 | 0.084 0.7 | 14 | 140 | 121 | 121 |
| 815863 | 288066 | 2823213 | 751 | Surface | La Higuerita | 0.50 | 0.012 0.6 | 30 | 9 | 31 | 31 |
| 815864 | 287910 | 2823328 | 793 | Surface | El Gallo Sur | 0.60 | 0.018 0.7 | 42 | 25 | 37 | 37 |
| 815865 | 287912 | 2823404 | 819 | Surface | El Gallo Sur | 0.80 0.013 0.058 | 2.6 | 22 | 60 | 64 | 64 |
| 815866 | 288133 | 2823628 | 994 | Surface | La Guacima | 0.70 | 4.7 | 6 | 8 | 10 | 10 |
| 815868 | 288133 | 2823629 | 994 | Surface | La Guacima | 0.70 | 0.025 2.4 | 4 | 23 | 8 | 8 |
| 815869 | 288132 | 2823629 | 995 | Surface | La Guacima | 1.00 | 0.477 47 | 21 | 76 | 57 | 57 |
| 815870 | 288131 | 2823630 | 995 | Surface | La Guacima | 1.00 | 0.328 36 | 10 | 40 | 15 | 15 |
| 815871 815873 | 288131 288130 | 2823631 2823631 | 996 996 | Surface | La Guacima Guacima | 1.00 0.50 | 0.238 19 3.01 198 | 24 13 | 34 105 | 87 81 | 87 81 |
| 815874 | 288163 | 2823645 | 1010 | Surface Surface | La La Guacima | 0.50 | 0.007 0.8 | 5 | 5 | 20 | 20 |
| 815876 | 288162 | 2823645 | 1007 | Surface | La Guacima | 0.50 | 0.019 6.7 | 8 | 8 | 15 | 15 |
| 814754 | 294161 | 2823521 | 1515 | Surface | El Peru | 0.50 | <0.005 <0.5 | 15 | 9 | 52 | 52 |
| 814755 | 294163 | 2823523 | 1515 | Surface | El Peru | 0.50 | <0.005 <0.5 | 21 | 12 | 75 | 75 |
| 814756 | 294168 | 2823544 | 1517 | Surface | El Peru | 1.00 | <0.005 <0.5 | 19 | 12 | 71 | 71 |
| 814757 | 294160 | 2823652 | 1580 | Surface | El Peru | 0.50 | <0.005 <0.5 | 9 | 6 | 17 | 17 |
| 814758 | 294156 | 2823654 | 1581 | Surface | El Peru | 0.50 | <0.005 <0.5 | 13 | 11 | 46 | 46 |
| 814759 | 294155 | 2823659 | 1582 | Surface | El Peru | 0.80 | <0.005 <0.5 | 8 | 7 | 20 | 20 |
| 814760 | 294180 | 2824644 | 1733 | Surface | Santa Cruz | 0.50 | <0.005 <0.5 | 7 | 15 | 47 | 47 |
| 815801 815802 | 289205 289195 | 2821765 2821718 | 840 828 | Surface Surface | Candelaria Sur Candelaria Sur | 0.50 0.50 | 0.302 1.2 0.005 <0.5 | 9 14 | 32 | 89 | 89 |
| 815803 | 289195 | 2821719 | 828 | Surface | Candelaria Sur | 0.50 | <0.005 <0.5 | 16 | <2 3 | 12 9 | 12 9 |
| 1.00 | <0.5 | ||||||||||
| 815804 | 289196 | 2821720 | 828 | Surface | Candelaria Sur | <0.005 | 9 | 5 | 14 | 14 | |
| 815805 | 289196 | 2821721 | 828 | Surface | Candelaria Sur | 1.00 | <0.005 <0.5 | 14 | 8 | 20 | 20 |
| 815806 | 289205 | 2821653 | 810 | Surface Surface | Candelaria Sur Candelaria Sur | 0.60 0.55 | 0.011 0.6 1.2 | 12 | 309 | 309 | 309 |
| 815807 815808 | 289249 289250 | 2821686 2821684 | 822 822 | Surface | Candelaria Sur | 0.50 | 0.008 0.01 1.8 | 14 29 | 156 217 | 127 211 | 127 211 |
| 815809 | 289282 | 2821783 | 843 | Surface | Candelaria Sur | 1.00 | 0.005 <0.5 | 9 | 11 | ||
| 815810 | 289279 | 2821777 | 842 | Surface | Candelaria Sur | 0.50 | <0.005 <0.5 | 6 | 8 | 43 34 | 43 34 |
| 289284 | 2821789 | 1.00 | 0.6 | 703 | 31 | 31 | |||||
| 815811 815813 | 289311 | 2821868 | 848 873 | Surface | Candelaria Sur | 0.50 | 0.005 0.042 | 42 133 | |||
| 815814 | 289311 | 2821908 | 900 | Surface Surface | Candelaria Sur Candelaria Sur | 0.50 | 0.009 | 17 | 404 158 | 351 343 | 351 343 |
| 1.9 0.5 | 9 | ||||||||||
| 815815 | 289313 | 2821924 2824829 | 904 1344 | Surface | Candelaria Sur | 0.50 0.70 | 0.005 | <0.5 | 49 | 65 | 65 |
| 814801 | 291992 | Surface | Northwest Jabali | 0.90 | <0.005 <0.005 | 6 5 | 8 8 | 22 25 | 22 25 | ||
| 814802 | 291992 | 2824829 | 1344 | Surface | Northwest Jabali | 0.90 | <0.5 <0.5 <0.5 | 8 | 31 | 31 | |
| 814803 814804 | 291992 291371 | 2824829 2824431 | 1344 1224 | Surface Surface | Jabali West of Jabali | <0.5 | 2 50 | 18 | 96 110 | 96 110 | |
| Northwest | 0.70 0.90 | <0.005 <0.005 <0.005 | 0.7 | 22 | |||||||
| 814805 814806 | 291371 | 2824431 | 1224 1224 | Surface Surface | West of Jabali West of Jabali | 0.90 | <0.5 | 71 | 26 | 141 | 141 |
| 814807 | 291371 291371 | 2824431 2824431 | 1224 | Surface | West of Jabali | 0.70 | <0.005 <0.005 | 0.5 | 95 | ||
| <0.5 | 50 37 | 77 | 77 | 77 | |||||||
| 814808 | 291371 | 2824431 | 1224 | Surface | West of Jabali | 1.00 | <0.005 0.617 | 32 | 38 10 | 796 | 796 |
| 815896 | 287663 | 2822032 | 808 | Surface | El Limon | 0.60 | 136 179 | 62 | 5180 2080 | 281 | 281 |
| 815897 | 287646 | 2822082 | 820 | Surface | Camino Camino El Limon | 0.40 | 0.875 | 31 | 182 | 182 | |
| 815898 | 287615 287616 | 2822234 | 835 | Surface | Camino El Limon Camino El Limon | 0.873 149 | 41 | 135 | |||
| 815899 | 2822235 | Surface | 1.10 0.50 | 86 | 155 | 144 | 144 | ||||
| 835 | El Limon | 0.558 | 40 | 471 | 471 | ||||||
| 815901 | 288264 | 2821508 | 760 | Surface | 0.40 | 27 | 58 | 1115 | |||
| 0.037 |

| Sample | Easting | Northing | Elevation | Surface/UG | Location | Width | Au | Ag Cu | Pb | Zn |
|---|---|---|---|---|---|---|---|---|---|---|
| 815903 | (m) | (m) 2821229 | (m) 678 | El Limon | (m) | (g/t) 0.008 | (g/t) (g/t) | (g/t) | (g/t) | |
| 815877 | 287905 288719 | 2821916 | 924 | Surface | Candelaria Working | 0.50 0.80 | 0.6 0.129 24 | 14 | 60 | 83 |
| 815878 | 288719 | 2821917 | 924 | Surface Surface | Candelaria Working | 0.50 | 0.021 4.9 | 44 47 | 613 31 | 187 418 |
| 815879 | 288720 | 2821917 | 924 | Surface | Candelaria Working | 0.90 | 0.011 3.5 | 47 | 26 | 540 |
| 815880 | 288720 | 2821917 | 924 | Surface | Candelaria Working | 0.65 | 0.045 3.8 | 32 | 217 | 400 |
| 815881 | 288721 | 2821917 | 925 | Surface | Candelaria Working | 0.80 | 0.008 2.2 | 30 | 28 | 716 |
| 815882 | 288721 | 2821918 | 925 | Surface | Candelaria Working | 0.60 | 0.012 4.7 | 15 | 21 | 311 |
| 815883 | 288722 | 2821918 | 925 | Surface | Candelaria Working | 0.50 | 0.015 2.9 | 15 | 50 | 200 |
| 815884 | 288727 | 2821910 | 923 | Surface | Candelaria Working | 0.50 | 0.047 15 | 44 | 1375 | 228 |
| 815885 | 288724 | 2821914 | 923 | Surface | Candelaria Working | 0.60 | 0.216 320 | 74 | 2080 | 259 |
| 815886 | 288635 | 2821817 | 874 | Underground | San Miguel Mine | 0.75 | 1.71 314 | 208 | 339 | 277 |
| 815887 | 288634 | 2821817 | 874 | Underground | San Miguel Mine | 0.75 | 0.357 68 | 143 | 194 | 183 |
| 815888 | 288632 | 2821819 | 874 | Underground | San Miguel Mine | 0.60 | 1.23 335 | 92 | 152 | 134 |
| 815889 | 288631 | 2821818 | 874 | Underground | San Miguel Mine | 0.55 | 0.606 68 | 133 | 223 | 220 |
| 815890 | 288631 | 2821818 | 874 | Underground | San Miguel Mine | 0.55 | 0.188 43 | 25 | 38 | 99 |
| 815891 | 288627 | 2821820 | 876 | Underground | San Miguel Mine | 0.60 | 38.3 4520 | 1945 | 4460 | 523 |
| 815892 | 288625 | 2821822 | 878 | Underground | San Miguel Mine | 0.60 | 0.482 77 | 546 | 415 | 143 |
| 815893 | 878 | Underground | Miguel Mine | 0.60 | 60 | 196 | ||||
| 815894 | 288621 | 2821823 | 880 | Surface | San San Miguel Mine | 0.624 1.055 | 43 | 499 | 188 | |
| 815895 | 288617 288616 | 2821825 2821825 | 880 | Surface | San Miguel Mine | 0.65 0.55 | 123 0.97 295 | 182 | 96 339 | 75 114 |
| 814733 | 292490 | 2824846 | 1465 | Surface | El JabalíNW | 0.50 | 0.005 <0.5 | 7 | 12 | 78 |
| 814734 | 292487 | 2824820 | 1460 | Surface | Jabali mine II | 0.65 | 15.95 #### | 50 | 17 | 42 |
| 814735 | 292487 | 2824820 | 1460 | Surface | Jabali mine II | 0.55 | 641 | 43 | 12 | 45 |
| 2824819 | 1461 | Surface | Jabali mine II | 0.998 0.033 | 12 | 19 | 12 | 46 | ||
| 814736 814737 | 292486 292486 | 2824819 | 1461 | Surface | Jabali mine II | 0.50 0.60 | 0.025 3.1 | 9 | 16 | 72 |
| 814738 | 292487 | 2824822 | 1460 | Surface | Jabali mine II | 0.50 | 0.037 5.1 | 14 | 14 | 54 |
| 814739 | 292450 | 2824837 | 1458 | Underground | Jabali mine II | 1.15 | 4.59 396 | 51 | 20 | 34 |
| 814741 | 292454 | 2824840 | 1458 | Underground | Jabali mine II | 0.75 | 6.54 157 | 36 | 17 | 58 |
| 814742 | 292455 | 2824834 | 1458 | Underground | Jabali mine II | 0.50 | 3.7 | 31 | 12 | 43 |
| 814743 | 292466 | 2824837 | 1442 | Underground | Jabali mine I | 1.00 | 0.487 2.52 | 126 29 | 18 | 20 |
| 814744 | 292466 | 2824837 | 1442 | Underground | Jabali mine I | 1.00 0.90 | 2.69 56 29 | 30 | 13 | 38 |
| 814745 814746 | 292470 292470 | 2824842 | 1442 1442 | Underground Underground | Jabali mine I | 0.85 | 0.368 0.43 32 | 16 14 | 10 11 | 31 34 |
| 814747 | 292473 | 2824842 2824846 | 1442 | Underground | Jabali mine I Jabali mine I | 1.00 | 0.16 1.2 | 13 | 12 | 58 |
| 814748 | 292509 | 2824826 | 1442 | Underground | Jabali mine I | 1.00 | 0.125 4.7 | 13 | 9 | 32 |
| 814749 | 292508 | 2824820 | 1442 | Underground | Jabali mine I | 0.65 | 0.854 50 | 6 | 21 | 26 |
| 814852 | 292508 | 2824814 | 1442 | Underground | Jabali mine I Jabali mine I | 0.60 | 2.01 201 | 9 | 9 | 21 |
| 814853 | 292508 | 2824814 2824802 | 1442 | Underground Underground | Jabali mine I | 0.60 | 1.995 119 | 34 | 50 | 56 |
| 814854 814855 | 292510 292512 | 2824792 | 1442 1442 | Surface | Jabali mine I | 0.50 0.50 | 1.475 19 2.62 6.9 | 15 14 | 17 47 | 20 47 |
| 814856 | 292480 | 2824724 | 1374 | Surface | El JabalíW | 0.50 | 0.092 4.9 | 11 | 11 | 32 |
| 2824722 | 1374 | Surface | El JabalíW | 0.60 | 0.213 1.6 | 15 | ||||
| 814857 | 292480 | 2824933 | 1458 | Surface | NE of Los Reyes | 1 | 0.009 <0.5 | 3 | 5 | 14 |
| 814809 814810 | 291222 291225 | 2824918 | 1458 | Surface | NE of Los Reyes | 0.5 | 0.032 0.6 | 7 | 10 21 | 14 19 |
| 814811 | 291221 | 2824914 | 1459 | Surface | NE of Los Reyes | 1 | 0.008 0.9 | 6 | 26 | 18 |
| 814812 | 291235 | 2824868 | 1445 | Surface | NE of Los Reyes | 1 | 1.9 | 5 | 27 | 36 |
| 814813 | 291248 | 2824804 | 1406 | Surface | NE of Los Reyes | 0.5 | 0.018 <0.005 | 2 | 16 | 60 |
| 814814 | 291247 | 2824800 | 1407 | Surface | NE of Los Reyes | <0.005 | <0.5 <0.5 <0.5 | 2 | 8 | 27 |
| 814816 | 290502 | 2824428 | 1076 | Surface | NE of Los Reyes | 1 0.8 | <0.005 | 5 | 12 | |
| 814817 | 290502 | 2824420 | 1076 | Surface | NE of Los Reyes | 0.7 | 0.296 | 3.4 7 | 16 | 10 44 |
| 814818 | 290502 | 2024420 | 1076 | Surface | NE of Los Reyes | 0.9 | 0.014 | 4 | 9 | 15 |
| 814861 | 294738 | 2823013 | 1755 | Surface | Desecho Perú | 0.50 | <0.5 <0.5 <0.5 | 2 1 | 15 | 17 |
| 814862 | 294733 | 2823015 | 1747 | Surface | Desecho Perú | 0.50 | <0.005 <0.005 | 15 | 22 | |
| 814863 | 294733 | 2823015 | 1747 | Surface | Desecho Perú | 0.50 | <0.005 <0.005 | 3 | 15 | 23 |
| 814864 | 294893 | 2822934 | 1869 | Surface | Desecho Perú | 0.50 | <0.5 <0.5 | 4 | 12 | 32 |
| 814761 | 290361 | 2823150 | 904 | Surface | Copalquin East | 0.50 | 0.7 | 58 | 39 | 86 |
| 814762 | 290365 | 2823150 | 905 | Surface | Copalquin East | 0.80 | 0.005 0.15 | 12 | 136 | 152 |
| 814763 | 290367 | 2823151 | 905 | Surface | Copalquin East | 0.70 | 17 | 146 175 | 88 | 86 164 |
| 814764 | 290368 | 2823153 | 905 | Surface | Copalquin East | 0.50 | 0.189 0.038 | 11 | ||
| 2823160 | 1.1 | 159 74 | 143 30 | 32 | ||||||
| 814765 | 290384 | 911 934 | Surface Surface | Copalquin East | 0.50 0.60 | 0.005 0.023 | 25 | 27 | 50 | |
| 814766 814767 | 290424 290502 | 2823181 2823173 | 967 | Surface | Copalquin East Copalquin East | 0.50 | 0.6 0.009 1.2 | 37 | 148 | 9 |
| 814768 | 290269 | 2823165 | 880 | Surface | Copalquin East | 0.80 0.50 | 1.01 770 13 | 2730 | 209 80 | 729 113 |
| 814769 | 290270 | 2823166 | 880 | Surface | Copalquin East | 131 | ||||
| 290273 | 2823163 | Surface | Copalquin East | 0.50 | 0.077 7.2 | 76 | 92 | |||
| 814770 | 880 | 233 | ||||||||
| 0.106 |




JORC Code, 2012 Edition -Table 1 Section 1 Sampling Techniques and Data
| Criteria | JORC Code explanation | Commentary |
|---|---|---|
| Sampling techniques | • Nature and quality of sampling (eg cut channels, random chips, or specific specialised industry standard measurement tools appropriate to the minerals under investigation, such as down hole gamma sondes, or handheld XRF instruments, etc). These examples should not be taken as limiting the broad meaning of sampling. • Include reference to measures taken to ensure sample representativity and the appropriate calibration of any measurement tools or systems used. • Aspects of the determination of mineralisation that are Material to the Public Report. • In cases where 'industry standard' work has been done this would be relatively simple (eg 'reverse circulation drilling was used to obtain 1 msamples from which 3 kg was pulverised to produce a 30 g charge for fire assay'). In other cases more explanation may be required, such as where there is coarse gold that has inherent sampling problems. Unusual commodities or mineralisation types (eg submarine nodules) may warrant disclosure of detailed information. | • Drill core samples are cut lengthwise with a diamond saw. Intervals are nominally 1 mbut may vary between 0.5 mto 1.5 mbased on geologic criteria. • The same side of the core is always sent to sample (left side of saw). • Reported intercepts are calculated as either potentially underground mineable (>100m down hole) or as potentially open-pit mineable (near surface). • Potentially underground mineable intercepts are calculated as length weighted averages of material greater than or equal to 1 g/t AuEQ_70 allowing up to 2m of internal dilution. • Potentially open-pit mineable intercepts are calculated as length weighted averages of material greater than or equal to 0.25 g/t AuEQ_70 allowing for up to 2m of internal dilution. • Rock Sawn Channel samples underground and surface are collected with the assistance of a handheld portable saw. The channels are 2.5 to 3cm deep and 6-8 cm wide along continuous lines oriented perpendicular to the mineralized structure. The samples are as representative as possible • Rock Sawn Channel surface samples were surveyed with a Handheld GPS then permanently mark with an aluminium tag and red colour spray across the strike of the outcrop over 1 metre. Samples are as representative as possible • Rock Sawn Channel underground samples were located after a compass and tape with the mine working having a surveyed control point at the portal, then permanently marked with an aluminium tag and red colour spray oriented perpendicular to the mineralized structure. Samples are as representative as possible • Soil sampling has been carried out by locating pre-planned points by handheld GPS and digging to below the first colour-change in the soil (or a maximum of 50 cm). In the arid environment there is a 1 - 10 cm organic horizon and a 10 - 30 cm B horizon above the regolith. Samples are sieved to -80 mesh in the field. Samples are collected on a 20 mx50mgrid or every20monN - S lines 50 mapart. These samples are considered representative of the medium being sampled and lines are appropriately oriented to the nearly E - W structural trend. |
| Drilling techniques | • Drill type (eg core, reverse circulation, open-hole hammer, rotary air blast, auger, Bangka, sonic, etc) and details (eg core diameter, triple or standard tube, depth of diamond tails, face-sampling bit or other type, whether core is oriented and if so, by what method, etc). | • Drilling is done with MP500 man-portable core rigs capable of drilling HQ size core to depths of 350-400m (depending on ground conditions), reducing to NQ size core for greater depths. Core is recovered in a standard tube. |

| Criteria | JORC Code explanation | Commentary |
|---|---|---|
| Drill sample recovery | • Method of recording and assessing core and chip sample recoveries and results assessed. • Measures taken to maximise sample recovery and ensure representative nature of the samples. • Whether a relationship exists between sample recovery and grade and whether sample bias may have occurred due to preferential loss/gain of fine/coarse material. | • Drill recovery is measured based on measured length of core divided by length of drill run. • Recovery in holes CDH-001 through CDH-025 and holes CDH-032 through CDH-077 was always above 90% in the mineralized zones. Detailed core recovery data are maintained in the project database. • Holes CDH-026 through CDH-031 had problems with core recovery in highly fractured, clay rich breccia zones. • There is no adverse relationship between recovery and grade identified to date. |
| Logging | • Whether core and chip samples have been geologically and geotechnically logged to a level of detail to support appropriate Mineral Resource estimation, mining studies and metallurgical studies. • Whether logging is qualitative or quantitative in nature. Core (or costean, channel, etc) photography. • The total length and percentage of the relevant intersections logged. | • Geotechnical and geological logging of the drill core takes place on racks in the company core shed. • Core samples have been geologically and geotechnically logged to a level of detail to support appropriate Mineral Resource estimation, mining studies and metallurgical studies. • Core logging is both qualitative or quantitative in nature. Photos are taken of each box of core before samples are cut. Photos of cut core intervals are taken after sampling. Core is wetted to improve visibility of features in the photos. • All core has been logged and photographed. • Rock sawn channel samples are marked, measured and photographed at location |
| Sub-sampling techniques and sample preparation | • If core, whether cut or sawn and whether quarter, half or all core taken. • If non-core, whether riffled, tube sampled, rotary split, etc and whether sampled wet or dry. • For all sample types, the nature, quality and appropriateness of the sample preparation technique. • Quality control procedures adopted for all sub-sampling stages to maximise representativity of samples. • Measures taken to ensure that the sampling is representative of the in situ material collected, including for instance results for field duplicate/second-half sampling. • Whether sample sizes are appropriate to the grain size of the material being sampled. | • Core is sawn and half core is taken for sample. • Samples are prepared using ALS Minerals Prep-31 crushing, splitting and pulverizing. This is appropriate for the type of deposit being explored. • Visual review to assure that the cut core is ½of the core is performed to assure representativity of samples. • Crushed core duplicates are split/collected by the laboratory and submitted for assay (1 in 30 samples) • Sample sizes are appropriate to the grain size of the material being sampled. • Rock sawn channel samples and soil samples are prepared using ALS Minerals Prep-31 crushing, splitting and pulverizing. This is appropriate for the type of deposit being explored. |
| Quality of assay data and laboratory tests | • The nature, quality and appropriateness of the assaying and laboratory procedures used and whether the technique is considered partial or total. | • Samples are assayed for gold using ALS Minerals Au-AA25 method a 30 g fire assay with an AA finish. This is considered a total assay technique. |

| Criteria | JORC Code explanation | Commentary |
|---|---|---|
| • For geophysical tools, spectrometers, handheld XRF instruments, etc, the parameters used in determining the analysis including instrument make and model, reading times, calibrations factors applied and their derivation, etc. • Nature of quality control procedures adopted (eg standards, blanks, duplicates, external laboratory checks) and whether acceptable levels of accuracy (ie lack of bias) and precision have been established. | • Samples are assayed for silver using ALS Minerals ME-ICP61 method. Over limits are assayed by silverOG63 and silverGRAV21. These are considered a total assay technique. • Standards and blanks are inserted at a rate of one per every 25 samples and one per every 40 samples, respectively. Pulp duplicate sampling is undertaken for 3% of all samples (see above). External laboratory checks will be conducted as sufficient samples are collected. Levels of accuracy (ie lack of bias) and precision have not yet been established. • Certified Reference Materials - Rock Labs and CDN CRMs have been used throughout the project including, low (~2 g/t Au), medium (~9 g/t Au) and high (~18g/t Au and ~40 g/t Au). Results are automatically checked on data import into the BEDROCK database to fall within 2 standard deviations of the expected value. • Samples with significant amounts of observed visible gold are also assayed by AuSCR21, a screen assay that analyses gold in both the milled pulp and in the residual oversize from pulverization. This has been done for holes CDH-075 and CDH-077. | |
| Verification of sampling and assaying | • The verification of significant intersections by either independent or alternative company personnel. • The use of twinned holes. • Documentation of primary data, data entry procedures, data verification, data storage (physical and electronic) protocols. • Discuss any adjustment to assay data. | • The verification of significant intersections by either independent or alternative company personnel has not been conducted. A re-assay program of pulp duplicates is currently in progress. • MTH has drilled one twin hole. Hole CDH-072, reported in the 15/6/2021 announcement, is a twin of holes EC-002 and UC-03. Results are comparable. • Documentation of primary data, data entry procedures, data verification, data storage (physical and electronic) protocols are maintained in the company's core facility. • Assay data have not been adjusted other than applying length |
| Location of data points | • Accuracy and quality of surveys used to locate drill holes (collar and down-hole surveys), trenches, mine workings and other locations used in Mineral Resource estimation. • Specification of the grid system used. • Quality and adequacy of topographic control. | • Drill collar coordinates are currently located by handheld GPS. Precise survey of hole locations is planned. Downhole surveys of hole deviation are recorded using a Reflex Multishot tool for all holes. A survey measurement is first collected at 15 meters downhole, and then every 50 meters until the end of the hole. Locations for holes have been surveyed with differential GPS to a sub 10 cm precision. • UTM/UPS WGS 84 zone 13N • High quality topographic control from LiDAR imagery and orthophotos covers the entire project area. |
| Data spacing and distribution | • Data spacing for reporting of Exploration Results. • Whether the data spacing and distribution is sufficient to establish the degree of geological and grade continuity appropriate for the Mineral Resource and Ore Reserve estimation procedure(s) and classifications applied. | • Data spacing is appropriate for the reporting of Exploration Results. • The Resource estimation re-printed in this announcement was originally released on 17 Nov 2021 • No sample compositing has been applied. |

| Criteria | JORC Code explanation | Commentary |
|---|---|---|
| • Whether sample compositing has been applied. | ||
| Orientation of data in relation to geological structure | • Whether the orientation of sampling achieves unbiased sampling of possible structures and the extent to which this is known, considering the deposit type. • If the relationship between the drilling orientation and the orientation of key mineralised structures is considered to have introduced a sampling bias, this should be assessed and reported if material. | • Cut lines are marked on the core by the geologists to assure that the orientation of sampling achieves unbiased sampling of possible structures. This is reasonably well observed in the core and is appropriate to the deposit type. • The relationship between the drilling orientation and the orientation of key mineralised structures is not considered to have introduced a sampling bias. • Rock sawn channel samples are cut perpendicular to the observed vein orientation wherever possible |
| Sample security | • The measures taken to ensure sample security. | • Samples are stored in a secure core storage facility until they are shipped off site by small aircraft and delivered directly to ALS Global sample preparation facility in Chihuahua, Mexico. ALS airfreights the sample pulps to their assaying facility in North Vancouver, BC, Canada |
| Audits or reviews | • The results of any audits or reviews of sampling techniques and data. | • A review with spot checks was conducted by AMC in conjunction with the resource estimate published 17 Nov 2021. Results were satisfactory to AMC. |
Section 2 Reporting of Exploration Results
| Criteria | JORC Code explanation | Commentary | Commentary | Commentary | Commentary | Commentary |
|---|---|---|---|---|---|---|
| Mineral tenement and land tenure status | • Type, reference name/number, location and ownership including agreements or material issues with third parties such as joint ventures, partnerships, overriding royalties, native title interests, historical sites, wilderness or national park and environmental settings. • The security of the tenure held at the time of reporting along with any known impediments to obtaining a licence to operate in | • Concessions at Copalquin | • Concessions at Copalquin | • Concessions at Copalquin | • Concessions at Copalquin | • Concessions at Copalquin |
| Mineral tenement and land tenure status | • Type, reference name/number, location and ownership including agreements or material issues with third parties such as joint ventures, partnerships, overriding royalties, native title interests, historical sites, wilderness or national park and environmental settings. • The security of the tenure held at the time of reporting along with any known impediments to obtaining a licence to operate in | No. | Concession | Concession Title number | Area (Ha) | Location |
| Mineral tenement and land tenure status | • Type, reference name/number, location and ownership including agreements or material issues with third parties such as joint ventures, partnerships, overriding royalties, native title interests, historical sites, wilderness or national park and environmental settings. • The security of the tenure held at the time of reporting along with any known impediments to obtaining a licence to operate in | 1 | LA SOLEDAD | 52033 | 6 | Tamazula, Durango, Mexico |
| Mineral tenement and land tenure status | • Type, reference name/number, location and ownership including agreements or material issues with third parties such as joint ventures, partnerships, overriding royalties, native title interests, historical sites, wilderness or national park and environmental settings. • The security of the tenure held at the time of reporting along with any known impediments to obtaining a licence to operate in | 2 | EL COMETA | 164869 | 36 | Tamazula, Durango, Mexico |
| Mineral tenement and land tenure status | • Type, reference name/number, location and ownership including agreements or material issues with third parties such as joint ventures, partnerships, overriding royalties, native title interests, historical sites, wilderness or national park and environmental settings. • The security of the tenure held at the time of reporting along with any known impediments to obtaining a licence to operate in | 3 | SAN MANUEL | 165451 | 36 | Tamazula, Durango, Mexico |
| Mineral tenement and land tenure status | • Type, reference name/number, location and ownership including agreements or material issues with third parties such as joint ventures, partnerships, overriding royalties, native title interests, historical sites, wilderness or national park and environmental settings. • The security of the tenure held at the time of reporting along with any known impediments to obtaining a licence to operate in | 4 | COPALQUIN | 178014 | 20 | Tamazula, Durango, Mexico |
| Mineral tenement and land tenure status | the area. | 5 | EL SOL | 236130 | 6,000 | Tamazula, Durango and Badiraguato, Sinaloa, México |
| Mineral tenement and land tenure status | the area. | 6 | EL CORRAL | 236131 | 907.3243 | Tamazula, Durango and Badiraguato, Sinaloa, México |

| Criteria | JORC Code explanation | Commentary |
|---|---|---|
| Exploration done by other parties | • Acknowledgment and appraisal of exploration by other parties. | • Previous exploration by Bell Coast Capital Corp. and UC Resources was done in the late 1990's and in 2005 - 2007. Work done by these companies is historic and non-JORC compliant. Mithril uses these historic data only as a general guide and will not incorporate work done by these companies in resource modelling. • Work done by the Mexican government and by IMMSA and will be used for modelling of historic mine workings which are now inaccessible (void model) |
| Geology | • Deposit type, geological setting and style of mineralisation. | • Copalquin is a low sulfidation epithermal gold-silver deposit hosted in andesite. This deposit type is common in the Sierra Madre Occidental of Mexico and is characterized by quartz veins and stockworks surrounded by haloes of argillic (illite/smectite) alteration. Veins have formed as both low- angle semi-continuous lenses parallel to the contact between granodiorite and andesite and as tabular veins in high-angle normal faults. Vein and breccia thickness has been observed up to 30 meters wide with average widths on the order of 3 to 5 meters. The overall strike length of the semi- continuous mineralized zone from El Gallo to Refugio, Cometa, Los Pinos, Los Reyes, La Montura to Constancia and Santa Cruz is almost 7 kilometres. The southern area from south west of Apomal to San Manuel and to Las Brujas-El Peru provides additional exploration potential up to 6km. |
| Drill hole Information | • A summary of all information material to the understanding of the exploration results including a tabulation of the following information for all Material drill holes: • easting and northing of the drill hole collar • elevation or RL (Reduced Level - elevation above • sea level in metres) of the drill hole collar • dip and azimuth of the hole • down hole length and interception depth • hole length. • If the exclusion of this information is justified on the basis that the information is not Material and this exclusion does not detract from the understanding of the report, the Competent Person should clearly explain why this is the case. | See Table 3 in the announcement for full details of the channel sample results |

| Criteria | JORC Code explanation | Commentary | Commentary | Commentary | Commentary | Commentary | Commentary | Commentary | Commentary | Commentary |
|---|---|---|---|---|---|---|---|---|---|---|
| Data aggregation methods | • In reporting Exploration Results, weighting averaging techniques, maximum and/or minimum grade truncations (eg cutting of high grades) and cut-off grades are usually Material and should be stated. • Where aggregate intercepts incorporate short lengths of high grade results and longer lengths of low grade results, the procedure used for such aggregation should be stated and some typical examples of such aggregations should be shown in detail. • The assumptions used for any reporting of metal equivalent values should be clearly stated. | • Potentially underground mineable intercepts are calculated as length weighted averages of material greater than or equal to 1 g/t AuEQ_70 allowing up to 2m of internal dilution. • Potentially open-pit mineable intercepts are calculated as length weighted averages of material greater than or equal to 0.25 g/t AuEQ_70 allowing for up to 2m of internal dilution. • No upper cut-off is applied to reporting intercepts. • Length weighted averaging is used to report intercepts. The example of CDH- | • Potentially underground mineable intercepts are calculated as length weighted averages of material greater than or equal to 1 g/t AuEQ_70 allowing up to 2m of internal dilution. • Potentially open-pit mineable intercepts are calculated as length weighted averages of material greater than or equal to 0.25 g/t AuEQ_70 allowing for up to 2m of internal dilution. • No upper cut-off is applied to reporting intercepts. • Length weighted averaging is used to report intercepts. The example of CDH- | • Potentially underground mineable intercepts are calculated as length weighted averages of material greater than or equal to 1 g/t AuEQ_70 allowing up to 2m of internal dilution. • Potentially open-pit mineable intercepts are calculated as length weighted averages of material greater than or equal to 0.25 g/t AuEQ_70 allowing for up to 2m of internal dilution. • No upper cut-off is applied to reporting intercepts. • Length weighted averaging is used to report intercepts. The example of CDH- | • Potentially underground mineable intercepts are calculated as length weighted averages of material greater than or equal to 1 g/t AuEQ_70 allowing up to 2m of internal dilution. • Potentially open-pit mineable intercepts are calculated as length weighted averages of material greater than or equal to 0.25 g/t AuEQ_70 allowing for up to 2m of internal dilution. • No upper cut-off is applied to reporting intercepts. • Length weighted averaging is used to report intercepts. The example of CDH- | • Potentially underground mineable intercepts are calculated as length weighted averages of material greater than or equal to 1 g/t AuEQ_70 allowing up to 2m of internal dilution. • Potentially open-pit mineable intercepts are calculated as length weighted averages of material greater than or equal to 0.25 g/t AuEQ_70 allowing for up to 2m of internal dilution. • No upper cut-off is applied to reporting intercepts. • Length weighted averaging is used to report intercepts. The example of CDH- | • Potentially underground mineable intercepts are calculated as length weighted averages of material greater than or equal to 1 g/t AuEQ_70 allowing up to 2m of internal dilution. • Potentially open-pit mineable intercepts are calculated as length weighted averages of material greater than or equal to 0.25 g/t AuEQ_70 allowing for up to 2m of internal dilution. • No upper cut-off is applied to reporting intercepts. • Length weighted averaging is used to report intercepts. The example of CDH- | • Potentially underground mineable intercepts are calculated as length weighted averages of material greater than or equal to 1 g/t AuEQ_70 allowing up to 2m of internal dilution. • Potentially open-pit mineable intercepts are calculated as length weighted averages of material greater than or equal to 0.25 g/t AuEQ_70 allowing for up to 2m of internal dilution. • No upper cut-off is applied to reporting intercepts. • Length weighted averaging is used to report intercepts. The example of CDH- | • Potentially underground mineable intercepts are calculated as length weighted averages of material greater than or equal to 1 g/t AuEQ_70 allowing up to 2m of internal dilution. • Potentially open-pit mineable intercepts are calculated as length weighted averages of material greater than or equal to 0.25 g/t AuEQ_70 allowing for up to 2m of internal dilution. • No upper cut-off is applied to reporting intercepts. • Length weighted averaging is used to report intercepts. The example of CDH- | • Potentially underground mineable intercepts are calculated as length weighted averages of material greater than or equal to 1 g/t AuEQ_70 allowing up to 2m of internal dilution. • Potentially open-pit mineable intercepts are calculated as length weighted averages of material greater than or equal to 0.25 g/t AuEQ_70 allowing for up to 2m of internal dilution. • No upper cut-off is applied to reporting intercepts. • Length weighted averaging is used to report intercepts. The example of CDH- |
| • In reporting Exploration Results, weighting averaging techniques, maximum and/or minimum grade truncations (eg cutting of high grades) and cut-off grades are usually Material and should be stated. • Where aggregate intercepts incorporate short lengths of high grade results and longer lengths of low grade results, the procedure used for such aggregation should be stated and some typical examples of such aggregations should be shown in detail. • The assumptions used for any reporting of metal equivalent values should be clearly stated. | Au Raw 7.51 11.85 | silver raw | Lengt h (m) | Au *length | silver *length | |||||
| • In reporting Exploration Results, weighting averaging techniques, maximum and/or minimum grade truncations (eg cutting of high grades) and cut-off grades are usually Material and should be stated. • Where aggregate intercepts incorporate short lengths of high grade results and longer lengths of low grade results, the procedure used for such aggregation should be stated and some typical examples of such aggregations should be shown in detail. • The assumptions used for any reporting of metal equivalent values should be clearly stated. | 678 | 0.5 | 3.755 | 339 | ||||||
| • In reporting Exploration Results, weighting averaging techniques, maximum and/or minimum grade truncations (eg cutting of high grades) and cut-off grades are usually Material and should be stated. • Where aggregate intercepts incorporate short lengths of high grade results and longer lengths of low grade results, the procedure used for such aggregation should be stated and some typical examples of such aggregations should be shown in detail. • The assumptions used for any reporting of metal equivalent values should be clearly stated. | 0 | 425 | 0.55 | 6.5175 | 233.75 | |||||
| • In reporting Exploration Results, weighting averaging techniques, maximum and/or minimum grade truncations (eg cutting of high grades) and cut-off grades are usually Material and should be stated. • Where aggregate intercepts incorporate short lengths of high grade results and longer lengths of low grade results, the procedure used for such aggregation should be stated and some typical examples of such aggregations should be shown in detail. • The assumptions used for any reporting of metal equivalent values should be clearly stated. | 0 | 0 | 0 | 0 | ||||||
| • In reporting Exploration Results, weighting averaging techniques, maximum and/or minimum grade truncations (eg cutting of high grades) and cut-off grades are usually Material and should be stated. • Where aggregate intercepts incorporate short lengths of high grade results and longer lengths of low grade results, the procedure used for such aggregation should be stated and some typical examples of such aggregations should be shown in detail. • The assumptions used for any reporting of metal equivalent values should be clearly stated. | 0.306 | 16 | 1 | 0.306 | 16 | |||||
| • In reporting Exploration Results, weighting averaging techniques, maximum and/or minimum grade truncations (eg cutting of high grades) and cut-off grades are usually Material and should be stated. • Where aggregate intercepts incorporate short lengths of high grade results and longer lengths of low grade results, the procedure used for such aggregation should be stated and some typical examples of such aggregations should be shown in detail. • The assumptions used for any reporting of metal equivalent values should be clearly stated. | 0.364 | 31.7 | 1 | 0.364 | 31.7 | |||||
| • In reporting Exploration Results, weighting averaging techniques, maximum and/or minimum grade truncations (eg cutting of high grades) and cut-off grades are usually Material and should be stated. • Where aggregate intercepts incorporate short lengths of high grade results and longer lengths of low grade results, the procedure used for such aggregation should be stated and some typical examples of such aggregations should be shown in detail. • The assumptions used for any reporting of metal equivalent values should be clearly stated. | 3.15 | 241 | 0.5 | |||||||
| • In reporting Exploration Results, weighting averaging techniques, maximum and/or minimum grade truncations (eg cutting of high grades) and cut-off grades are usually Material and should be stated. • Where aggregate intercepts incorporate short lengths of high grade results and longer lengths of low grade results, the procedure used for such aggregation should be stated and some typical examples of such aggregations should be shown in detail. • The assumptions used for any reporting of metal equivalent values should be clearly stated. | 1.575 | 120.5 | ||||||||
| • In reporting Exploration Results, weighting averaging techniques, maximum and/or minimum grade truncations (eg cutting of high grades) and cut-off grades are usually Material and should be stated. • Where aggregate intercepts incorporate short lengths of high grade results and longer lengths of low grade results, the procedure used for such aggregation should be stated and some typical examples of such aggregations should be shown in detail. • The assumptions used for any reporting of metal equivalent values should be clearly stated. | 10.7 | 709 | 0.5 | 5.35 | 354.5 | |||||
| • In reporting Exploration Results, weighting averaging techniques, maximum and/or minimum grade truncations (eg cutting of high grades) and cut-off grades are usually Material and should be stated. • Where aggregate intercepts incorporate short lengths of high grade results and longer lengths of low grade results, the procedure used for such aggregation should be stated and some typical examples of such aggregations should be shown in detail. • The assumptions used for any reporting of metal equivalent values should be clearly stated. | 15.6 | 773 | 0.5 | 7.8 | 386.5 | From | Length | Au gpt | silver gpt | |
| • In reporting Exploration Results, weighting averaging techniques, maximum and/or minimum grade truncations (eg cutting of high grades) and cut-off grades are usually Material and should be stated. • Where aggregate intercepts incorporate short lengths of high grade results and longer lengths of low grade results, the procedure used for such aggregation should be stated and some typical examples of such aggregations should be shown in detail. • The assumptions used for any reporting of metal equivalent values should be clearly stated. | 4.55 | 25.667 | 1481.9 | 91.95 | 4.55 | 5.64 | 325.7 | |||
| • In reporting Exploration Results, weighting averaging techniques, maximum and/or minimum grade truncations (eg cutting of high grades) and cut-off grades are usually Material and should be stated. • Where aggregate intercepts incorporate short lengths of high grade results and longer lengths of low grade results, the procedure used for such aggregation should be stated and some typical examples of such aggregations should be shown in detail. • The assumptions used for any reporting of metal equivalent values should be clearly stated. | • In determining the gold equivalent (AuEq.) grade for reporting, a gold:silver price ratio of 70:1 was determined, using the formula: AuEq grade = Au grade + ((silver grade/70) x (silver recovery/Au recovery)). The metal prices used to determine the 70:1 ratio are the cumulative average prices for 2021: gold USD1,798.34 and silver: USD25.32 (actual is 71:1) from kitco.com. At this early stage, the metallurgical recoveries are assumed to be equal (93%), Subsequent preliminary metallurgical test work produced recoveries of 91% for silver and 96% for gold (ASX Announcement 25 February 2022). • For Rock Saw Channel Sampling and soil sampling in the Copalquin | • In determining the gold equivalent (AuEq.) grade for reporting, a gold:silver price ratio of 70:1 was determined, using the formula: AuEq grade = Au grade + ((silver grade/70) x (silver recovery/Au recovery)). The metal prices used to determine the 70:1 ratio are the cumulative average prices for 2021: gold USD1,798.34 and silver: USD25.32 (actual is 71:1) from kitco.com. At this early stage, the metallurgical recoveries are assumed to be equal (93%), Subsequent preliminary metallurgical test work produced recoveries of 91% for silver and 96% for gold (ASX Announcement 25 February 2022). • For Rock Saw Channel Sampling and soil sampling in the Copalquin | • In determining the gold equivalent (AuEq.) grade for reporting, a gold:silver price ratio of 70:1 was determined, using the formula: AuEq grade = Au grade + ((silver grade/70) x (silver recovery/Au recovery)). The metal prices used to determine the 70:1 ratio are the cumulative average prices for 2021: gold USD1,798.34 and silver: USD25.32 (actual is 71:1) from kitco.com. At this early stage, the metallurgical recoveries are assumed to be equal (93%), Subsequent preliminary metallurgical test work produced recoveries of 91% for silver and 96% for gold (ASX Announcement 25 February 2022). • For Rock Saw Channel Sampling and soil sampling in the Copalquin | • In determining the gold equivalent (AuEq.) grade for reporting, a gold:silver price ratio of 70:1 was determined, using the formula: AuEq grade = Au grade + ((silver grade/70) x (silver recovery/Au recovery)). The metal prices used to determine the 70:1 ratio are the cumulative average prices for 2021: gold USD1,798.34 and silver: USD25.32 (actual is 71:1) from kitco.com. At this early stage, the metallurgical recoveries are assumed to be equal (93%), Subsequent preliminary metallurgical test work produced recoveries of 91% for silver and 96% for gold (ASX Announcement 25 February 2022). • For Rock Saw Channel Sampling and soil sampling in the Copalquin | • In determining the gold equivalent (AuEq.) grade for reporting, a gold:silver price ratio of 70:1 was determined, using the formula: AuEq grade = Au grade + ((silver grade/70) x (silver recovery/Au recovery)). The metal prices used to determine the 70:1 ratio are the cumulative average prices for 2021: gold USD1,798.34 and silver: USD25.32 (actual is 71:1) from kitco.com. At this early stage, the metallurgical recoveries are assumed to be equal (93%), Subsequent preliminary metallurgical test work produced recoveries of 91% for silver and 96% for gold (ASX Announcement 25 February 2022). • For Rock Saw Channel Sampling and soil sampling in the Copalquin | • In determining the gold equivalent (AuEq.) grade for reporting, a gold:silver price ratio of 70:1 was determined, using the formula: AuEq grade = Au grade + ((silver grade/70) x (silver recovery/Au recovery)). The metal prices used to determine the 70:1 ratio are the cumulative average prices for 2021: gold USD1,798.34 and silver: USD25.32 (actual is 71:1) from kitco.com. At this early stage, the metallurgical recoveries are assumed to be equal (93%), Subsequent preliminary metallurgical test work produced recoveries of 91% for silver and 96% for gold (ASX Announcement 25 February 2022). • For Rock Saw Channel Sampling and soil sampling in the Copalquin | • In determining the gold equivalent (AuEq.) grade for reporting, a gold:silver price ratio of 70:1 was determined, using the formula: AuEq grade = Au grade + ((silver grade/70) x (silver recovery/Au recovery)). The metal prices used to determine the 70:1 ratio are the cumulative average prices for 2021: gold USD1,798.34 and silver: USD25.32 (actual is 71:1) from kitco.com. At this early stage, the metallurgical recoveries are assumed to be equal (93%), Subsequent preliminary metallurgical test work produced recoveries of 91% for silver and 96% for gold (ASX Announcement 25 February 2022). • For Rock Saw Channel Sampling and soil sampling in the Copalquin | • In determining the gold equivalent (AuEq.) grade for reporting, a gold:silver price ratio of 70:1 was determined, using the formula: AuEq grade = Au grade + ((silver grade/70) x (silver recovery/Au recovery)). The metal prices used to determine the 70:1 ratio are the cumulative average prices for 2021: gold USD1,798.34 and silver: USD25.32 (actual is 71:1) from kitco.com. At this early stage, the metallurgical recoveries are assumed to be equal (93%), Subsequent preliminary metallurgical test work produced recoveries of 91% for silver and 96% for gold (ASX Announcement 25 February 2022). • For Rock Saw Channel Sampling and soil sampling in the Copalquin | • In determining the gold equivalent (AuEq.) grade for reporting, a gold:silver price ratio of 70:1 was determined, using the formula: AuEq grade = Au grade + ((silver grade/70) x (silver recovery/Au recovery)). The metal prices used to determine the 70:1 ratio are the cumulative average prices for 2021: gold USD1,798.34 and silver: USD25.32 (actual is 71:1) from kitco.com. At this early stage, the metallurgical recoveries are assumed to be equal (93%), Subsequent preliminary metallurgical test work produced recoveries of 91% for silver and 96% for gold (ASX Announcement 25 February 2022). • For Rock Saw Channel Sampling and soil sampling in the Copalquin |

| Criteria | JORC Code explanation | Commentary |
|---|---|---|
| Relationship between mineralisation widths and intercept lengths | • These relationships are particularly important in the reporting of Exploration Results. • If the geometry of the mineralisation with respect to the drill hole angle is known, its nature should be reported. • If it is not known and only the down hole lengths are reported, there should be a clear statement to this effect (eg 'down hole length, true width not known'). | • True widths at Refugio between sections 120 and 1,000 vary according to the hole's dip. Holes drilled at -50 degrees may be considered to have intercept lengths equal to true-widths, Holes drilled at -70 degrees had true widths approximately 92% of the reported intercept lengths and holes drilled at -90 degrees had true widths of 77% of the reported intercept lengths. • True widths at La Soledad are not fully understood and downhole intercepts to date, are reported. • At Las Brujas in Target 2, true widths are not yet known since we are still in the early stages of target definition. • Rock sawn channel samples are cut perpendicular to the observed vein orientation wherever possible |
| Diagrams | • Appropriate maps and sections (with scales) and tabulations of intercepts should be included for any significant discovery being reported. These should include, but not be limited to a plan view of drill hole collar locations and appropriate sectional views. | See figures in announcement |
| Balanced reporting | • Where comprehensive reporting of all Exploration Results is not practicable, representative reporting of both low and high grades and/or widths should be practiced to avoid misleading reporting of Exploration Results. | • All exploration results are reported for intercepts greater than or equal to 0.1 g/t gold equivalent (gold plus silver at 70:1 price ratio for gold:silver). |
| Other substantive exploration data | • Other exploration data, if meaningful and material, should be reported including (but not limited to): geological observations; geophysical survey results; geochemical survey results; bulk samples - size and method of treatment; metallurgical test results; bulk density, groundwater, geotechnical and rock characteristics; potential deleterious or contaminating substances. | • No additional exploration data are substantive at this time. • Metallurgical test work on drill core composite made of crushed drill core from the El Refugio drill hole samples has been conducted. • The samples used for the test work are representative of the material that makes up the majority of the Maiden Resource Estimate for El Refugio release on 17 th November 2021. • The test work was conducted by SGS laboratory Mexico using standard reagents and test equipment. |

| Criteria | JORC Code explanation | Commentary |
|---|---|---|
| Further work | • The nature and scale of planned further work (eg tests for lateral extensions or depth extensions or large-scale step-out drilling). • Diagrams clearly highlighting the areas of possible extensions, including the main geological interpretations and future drilling areas, provided this information is not commercially sensitive. | • The Company drilled 148 diamond core holes from July 2020 to July 2022 for 32,712 m. The Company has stated its target to drill up to 45,000m from July 2025 until the second half of 2026 • Diagrams are included in the announcements and presentations showing the drill target areas within the Copalquin District |